


Introduction
In part 1 of this article we took a broad look at the things that can take one or more of your websites “down”. Here in part 2 we’ll take a look at the practical side of things of what and how to check.
As a web host, you should dedicate the time to learn and test the contents of this article. Spin up a cheap test server for a day or two, add a site or two, and go through each section.
Like part 1, this is NOT about issues that could potentially occur after a migration. We have a separate troubleshooting doc that covers every known issue that you check out here:
If you haven’t already read part 1, you can do so here:
Sites are Down! Part 1: Here’s What Everyone Needs to Know
To follow along with this article, you will need to connect to your server via SSH. Please see the following articles to get started:
Step 1. Generate your SSH Key
Step 2. Add your SSH Key to vCanopy (also see Add default SSH Keys)
Step 3. Connect to your server by SSH as Root user (we like and use Termius)
Quick First Checks
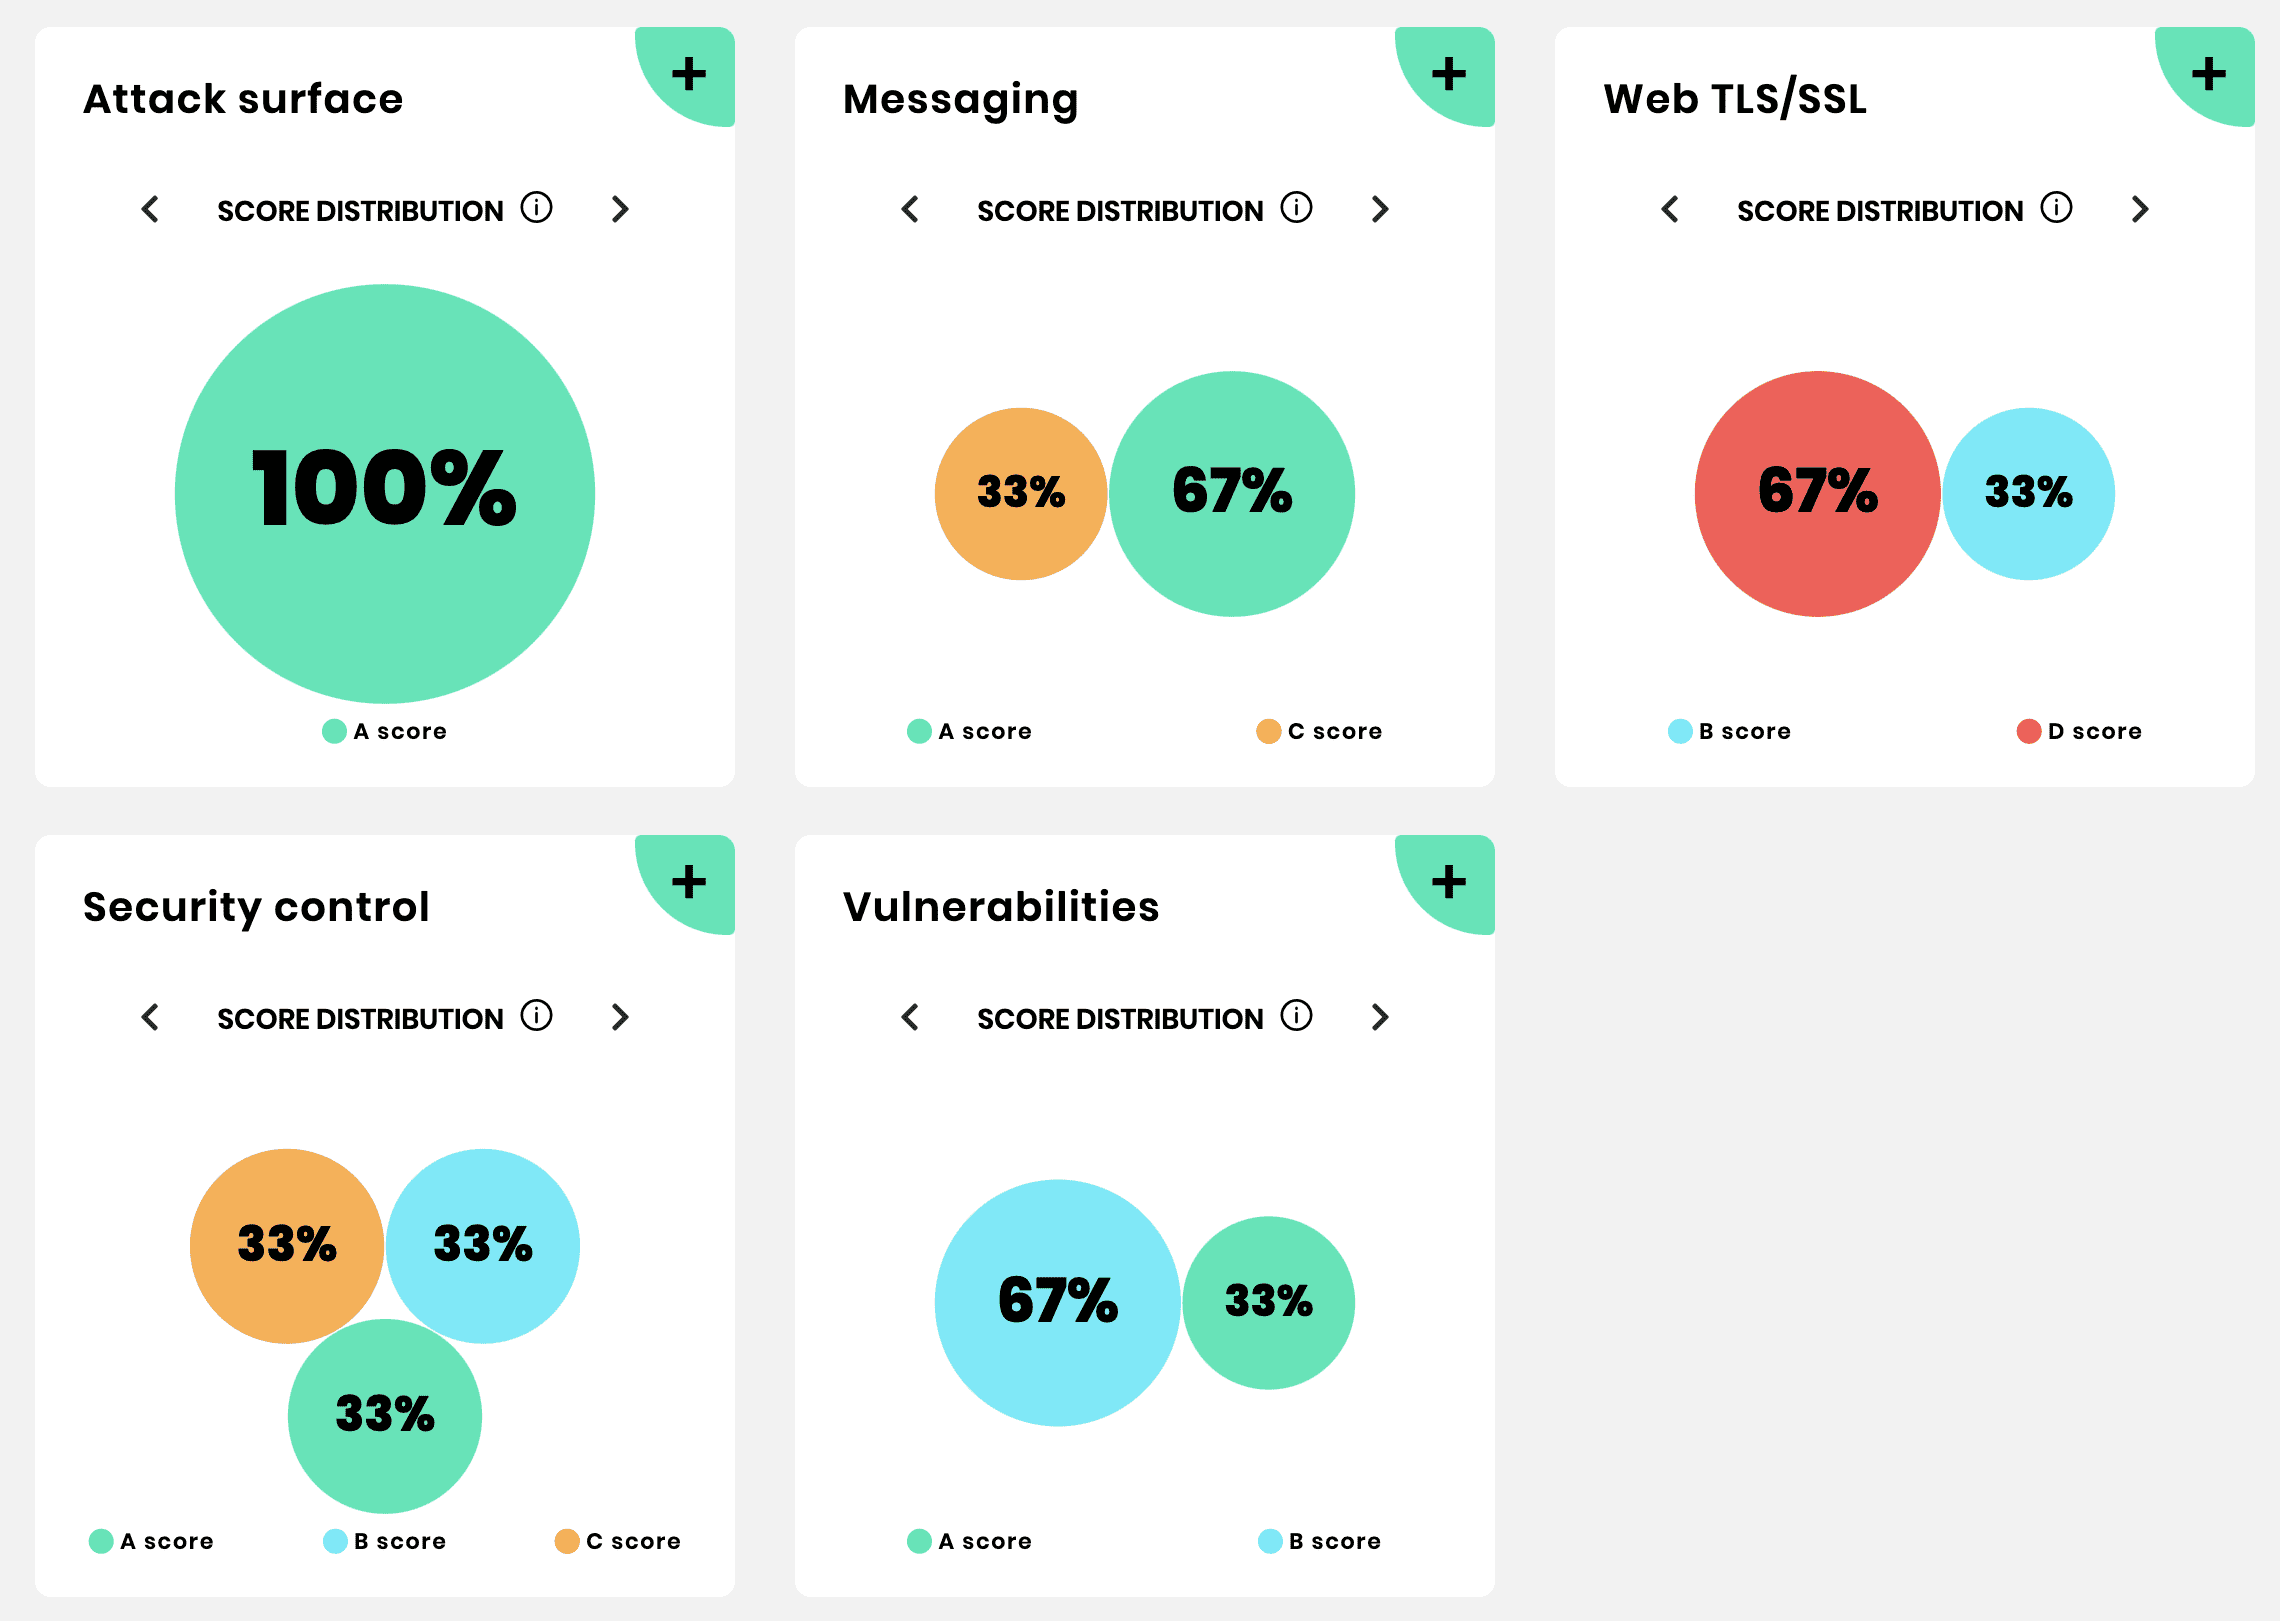
- Open Monit – are there obvious issues like services down, high swap usage, and/or high CPU usage?
- Check the domain is spelled correctly and hasn’t expired
- Check the DNS is correct (https://dnschecker.org/#A) – if using Cloudflare’s proxy check via our integration or inside your account
- Check whether your server provider is having an outage
- Check the server disk space isn’t full – Monit will send A LOT of notifications if your disk space starts filling up close to capacity
- Clear the cache
- Run a permissions fix (go to your Self Help Tools page, choose “Quick Fixes“, select your server and site, check “Reset Permissions“, and click the Start Task button)
Services are down (MySQL, PHP, Nginx, OLS)
If for some reason a service is down, Monit will automatically attempt to restart it. If that fails, you can also try to restart inside of Monit by clicking on the name of the service, or running a quick command on the command line:
gp mysql restart
gp php7.4 restart
gp ngx restart
systemctl restart lsws
If for any reason it still won’t restart, it will provide a reason in the output.
NGINX/OLS SYNTAX ERRORS
Syntax errors happen for one of two reasons – there’s a file that Nginx/OLS is trying to load, and it’s no longer there, or there’s an actual error in the code.
Checking the syntax before reloading Nginx will let you know if there are any issues immediately. On OLS, that’s not the case, and you can only find out if a syntax error exists after the fact. Fortunately, undoing what you may have just done in either case is simple.
If Nginx is down due to a syntax issue, this will need to be corrected before attempting a restart.
To check the Nginx syntax run:
nginx -t
To check the OpenLiteSpeed syntax run:
/usr/local/lsws/bin/openlitespeed -t
Check Your Logs
Always check the logs. Yes, there’s a lot of information in them, and some of it you may not understand, but the logs are part and parcel of web hosting and you don’t need to understand everything being reported to identify the cause of an issue.
WEBSITE NGINX/OPENLITESPEED ERROR LOGS
The first log you should check is the website error log. If you’re having any kind of codebase issues, you’ll find details on this here. Here are a few quick tips:
- Upstream timeouts indicate long-running requests (common with 502/504 errors) – check for code errors, check the database for locked tables/sleeping queries, enable PHP slow logging and MySQL slow logging.
- For SendGrid/Fail2Ban/Firewall/7G errors – disable them and then re-enable them, and then flush the cache.
- Critical/Fatal errors will be obvious – be sure to read the whole entry.
The above are by no means comprehensive, but they do cover a lot of common issues.
WEBSITE ACCESS LOGS
If one of your websites is under high load your access logs will make it pretty easy to confirm – when you open them up in the customizer it will take longer than average to load and the timestamps at the beginning of each line will all be pretty close in time to each other.
Attacks often target xmlrpc.php and wp-login.php, both of which you can secure using our security measures and WPFail2Ban integration.
NGINX SERVERS: PHP FPM LOGS
If you’re experiencing 502/504 errors your Nginx PHP logs may indicate that you’re maxing out your PHP workers. You may see entries like this:
[03-Dec-2021 01:59:02] WARNING: [pool examplewebsite.com74] seems busy (you may need to increase pm.start_servers, or pm.min/max_spare_servers), spawning 16 children, there are 0 idle, and 5 total children
More often than not this is a codebase issue – either long-running requests or locked/sleeping database tables. It may indicate high load though – the access logs should make this easy to confirm.
MYSQL ERROR LOG
Check MySQL for too many connections:
2021-03-31T12:29:15.297826Z 38356 [Warning] [MY-000000] [Server] Too many connections
See the MySQL/Database Checks section below for further details.
SLOW LOGGING
You can activate MySQL slow logging in the server customizer, and you can activate PHP slow logging on a per-site basis within the website’s PHP tab.
Identifying slow requests will help you identify the bottlenecks in your code. These aren’t server-level errors, so they require fixes at the WordPress level.
Critical Error / 500 Error Checks
If it’s a critical error or a 500 error, first check your website errors logs, this will very likely point to you to the issue at hand (see the section above).
FATAL ERRORS
Are fatal errors being reported? For the most part, you’ll probably know what the cause is, as you’ve likely just made a change on your site.
The logs are usually pretty clear about what’s going on, especially for critical errors where it will tell you the exact reason for the error. More often than not.
MANUALLY DISABLE A PLUGIN
To deactivate a plugin that’s taken your website down, you can manually rename its folder. The code that’s causing the error on the site will no longer be loaded and the site will come back online.
You can rename a plugin folder via SFTP or SSH, quickly and easily.
.HTACCESS MISCONFIGURED (OLS ONLY)
If you’ve recently edited your .htaccess, or you’ve imported one in from your previous host, this may be the cause.
Inside your htdocs directory you’ll find a backup of our .htaccess called: .htaccess.bk
You can display this with:
cat /var/www/site.url/htdocs/.htaccess.bk
Here you can rename the existing .htaccess file, and either copy the contents of .htaccess.bk into a new .htaccess, or simply rename .htaccess.bk.
Other sites on the server will also have this as well.
Check top / htop for Load and CPU Steal
If you’re experiencing high load, top and htop will both make identifying the primary sites pretty easy – you’ll see your site’s system user in the user column.
These two programs will give you a live overview of exactly what’s going on on your server. You’ll see individual PHP processes and MySQL CPU usage, and this can be a good indicator of whether you’re experiencing high load or not, and whether it’s mostly your database or PHP.
Using top you can also check for CPU steal (and iowait):
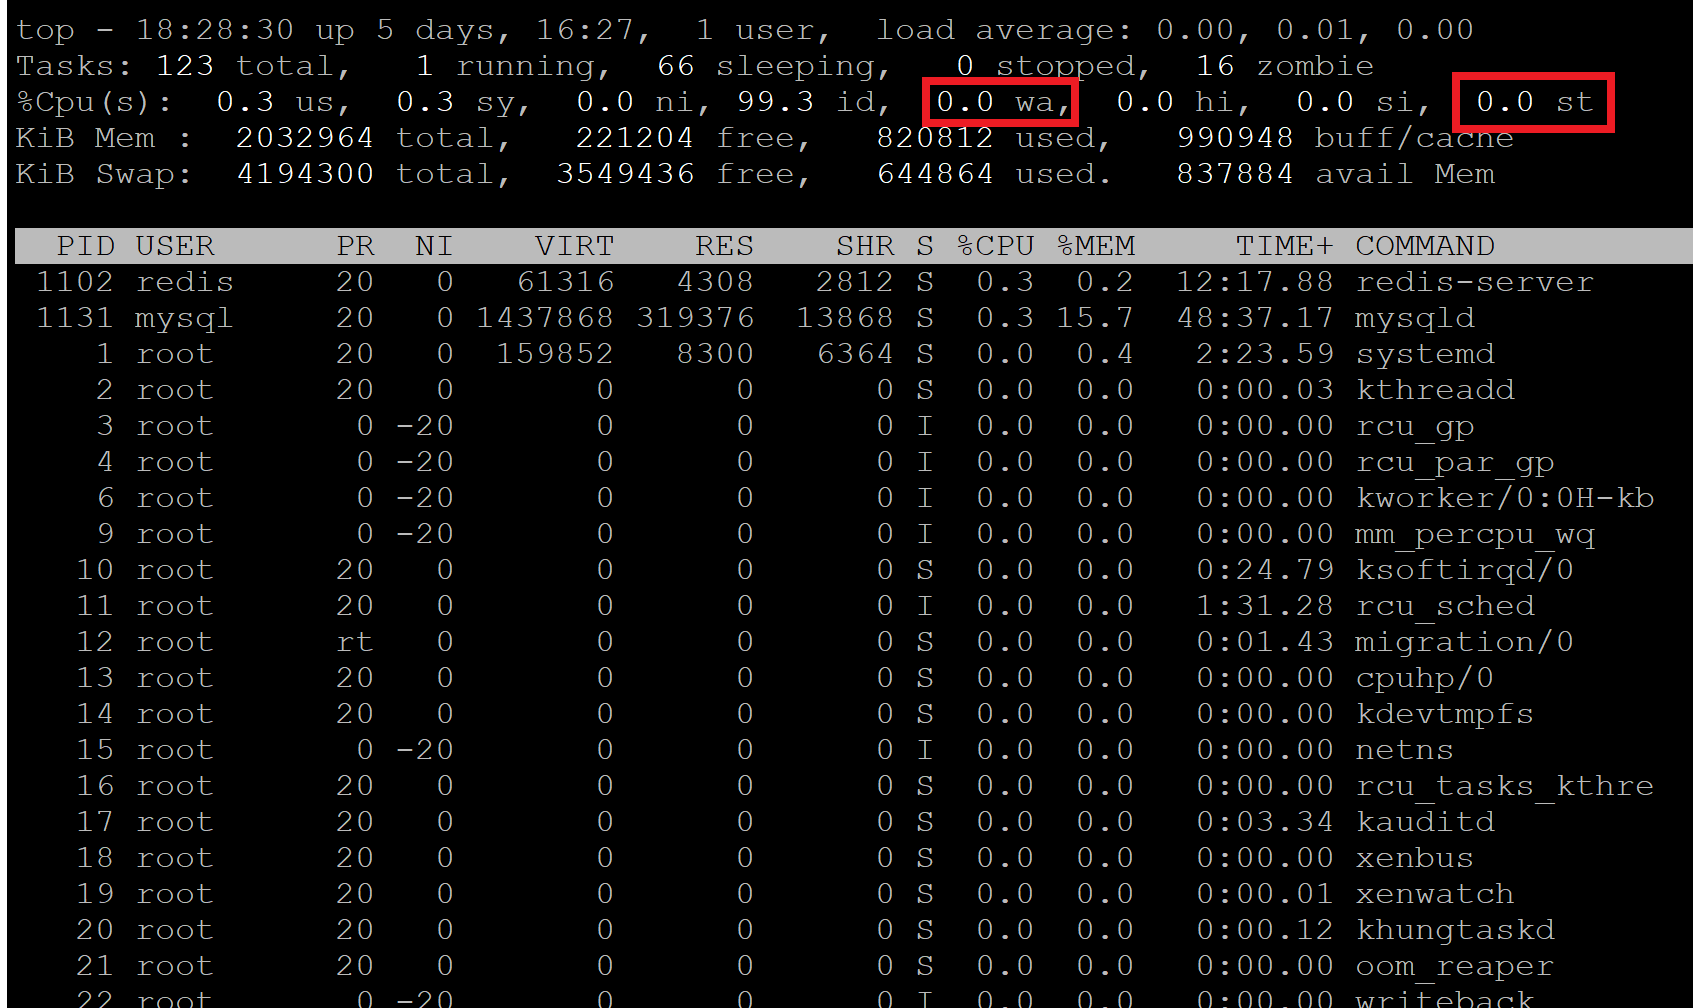
If either of these are high, then you’ll suffer performance issues. Steal (st) means that another VPS on your server is using more than it’s allocated CPU usage and it’s infringing on your own resources (contact your server provider and let them know you’re suffering steal).
I/O Wait means some processes are running via disk instead of RAM, and if this is high then the CPU is waiting on the IO/drives, which is highly inefficient. Your server needs more RAM to cope with the workload.
To dig deeper into top and htop, you can check out the following article:
MySQL/Database Checks
Like most things in this article, checking your database over is quick and simple.
Database table locks are a common cause of 502/504 errors. It’s one of the first checks our team would do on seeing these errors. In extreme cases, it can also lead to the “Error Establishing a Database Connection” error.
Lorem ipsum dolor sit amet, consectetur adipiscing elit. Ut elit tellus, luctus nec ullamcorper mattis, pulvinar dapibus leo.
IMPORTANT
If your disk space is full, MySQL will go down, and all of your websites will go down with it, with the "Error Establishing a Database Connection" error. See this section.
CHECK 1. IS MYSQL UP AND RUNNING?
If MySQL is down, Monit will send you notifications that it’s down and has been unable to restart it.
You can try to manually Restart within Monit, and/or Stop and then Start it again.
On the command line, you can restart MySQL with:
gp mysql restart
gp mysql stop
gp mysql start
If there’s an issue with MySQL, the output when running these commands directly will let you know what’s going on.
CHECK 2. ARE THERE DATABASE TABLE LOCKS?
Connect to your server over SSH and login to MySQL with:
gp mysql login root
Then show what’s going on with:
show processlist;
Do you see a build-up of locked tables or sleeping queries? Table locks look like this:
mysql> show processlist;
+-------+---------------------+-----------+---------------------+---------+--------+---------------------------------+------------------------------------------------------------------------------------------------------+-----------+---------------+
| Id | User | Host | db | Command | Time | State | Info | Rows_sent | Rows_examined |
+-------+---------------------+-----------+---------------------+---------+--------+---------------------------------+------------------------------------------------------------------------------------------------------+-----------+---------------+
| 5 | event_scheduler | localhost | NULL | Daemon | 558150 | Waiting on empty queue | NULL | 0 | 0 |
| 34478 | VOO_example_com | localhost | VOO_example_com | Sleep | 70388 | | NULL | 0 | 0 |
| 34479 | VOO_example_com | localhost | NULL | Sleep | 70388 | | NULL | 6230 | 6230 |
| 34480 | VOO_example_com | localhost | NULL | Sleep | 70387 | | NULL | 748034 | 748034 |
| 40581 | VOO_example_com | localhost | VOO_example_com | Query | 14241 | Waiting for table metadata lock | DROP TABLE IF EXISTS wp_bv_ip_store | 0 | 0 |
| 40582 | VOO_example_com | localhost | VOO_example_com | Query | 14140 | Waiting for table metadata lock | DROP TABLE IF EXISTS wp_bv_ip_store | 0 | 0 |
| 40583 | VOO_example_com | localhost | VOO_example_com | Query | 14040 | Waiting for table metadata lock | DROP TABLE IF EXISTS wp_bv_ip_store | 0 | 0 |
| 40984 | VOO_example_com | localhost | VOO_example_com | Query | 12582 | Waiting for table metadata lock | SELECT * FROM wp_bv_ip_store WHERE '�<:' >= `start_ip_range` && '�<:' <= `end_ip_range` && `is_lp` | 0 | 0 |
| 40985 | VOO_example_com | localhost | VOO_example_com | Query | 12518 | Waiting for table metadata lock | SELECT * FROM wp_bv_ip_store WHERE '�<:' >= `start_ip_range` && '�<:' <= `end_ip_range` && `is_lp` | 0 | 0 |
Sleeping queries don’t offer as much information but can still directly lead to 502/504 errors:
mysql> show processlist;
+------+-----------------+-----------+---------------------------+---------+------+------------------------+------------------+---------+-----------+---------------+
| Id | User | Host | db | Command | Time | State | Info | Time_ms | Rows_sent | Rows_examined |
+------+-----------------+-----------+---------------------------+---------+------+------------------------+------------------+---------+-----------+---------------+
| 5   | event_scheduler | localhost | NULL | Daemon | 741 | Waiting on empty queue | NULL | 741147 | 0 | 0 |
| 927 | xsV_example_com | localhost | xsV_example_com | Sleep | 158 | | NULL | 158305 | 1 | 1 |
| 928 | xsV_example_com | localhost | xsV_example_com | Sleep | 159 | | NULL | 158394 | 1 | 1 |
| 929 | xsV_example_com | localhost | xsV_example_com | Sleep | 158 | | NULL | 157506 | 1 | 1 |
| 931 | xsV_example_com | localhost | xsV_example_com | Sleep | 156 | | NULL | 156025 | 1 | 1 |
| 932 | xsV_example_com | localhost | xsV_example_com | Sleep | 156 | | NULL | 155932 | 1 | 1 |
| 933 | xsV_example_com | localhost | xsV_example_com | Sleep | 157 | | NULL | 156652 | 1 | 1 |
| 992 | xsV_example_com | localhost | xsV_example_com | Sleep | 56 | | NULL | 57623 | 1 | 1 |
| 994 | xsV_example_com | localhost | xsV_example_com | Sleep | 56 | | NULL | 55338 | 1 | 1 |
| 995 | xsV_example_com | localhost | xsV_example_com | Sleep | 56 | | NULL | 56001 | 1 | 1 |
If you do see either of the above, exit MySQL with:
exit
Now logged out of MySQL, you can restart it with:
gp mysql restart
CHECK 3. IS THE CONNECTION LIMIT EXHAUSTED?
Generally, this is never going to pose an issue for most sites, even extremely busy sites. It can occur when things like extreme table locking occur which can cause the connection pool to max out, but clearing the table locks by restarting MySQL will fix this immediately.
Where it can be an issue is if a plugin in your website is making multiple requests to the database, and these add up far beyond normal. In these cases, they could max your connection limit (200 connections by default), which could cause unnecessary 502/504 errors. Still logged into MySQL (see check 2 above), run the following:
show status like '%onn%';
What you’re looking to determine is whether your database is being swamped with tasks that it’s unable to keep up with.
If you’re seeing a large list of tasks – looks like hundreds, check your MySQL log in your server customizer for these errors:
2021-03-31T12:26:46.407886Z 38351 [Warning] [MY-000000] [Server] Too many connections
2021-03-31T12:26:48.164792Z 38352 [Warning] [MY-000000] [Server] Too many connections
2021-03-31T12:28:04.670871Z 38355 [Warning] [MY-000000] [Server] Too many connections
2021-03-31T12:29:15.297826Z 38356 [Warning] [MY-000000] [Server] Too many connections
...
2021-03-31T12:29:24.812716Z 38357 [Warning] [MY-000000] [Server] Too many connections
Hundreds of queries will likely mean that they aren’t able to finish fast enough – which could be due to not having enough RAM for both PHP and MySQL to run optimally. MySQL slow logging may be able to help.
In cases like these ensure you have Redis Object caching enabled and you convert any MyISAM tables to InnoDB.
If you do believe this to be a plugin, you can increase the connection limit to 300 with:
gp stack mysql -max-connections 300
Or replace 300 with you’re own custom limit. Learn more here:
Define the maximum number of simultaneous client connections to the MySQL Server
CHECK 4. IS THE DATABASE CORRUPT?
Check your sites database integrity with the following (switch “site.url” with your site’s URL):
gp wp site.url db check
Are there corrupt tables? If yes, you can run a repair with:
gp wp site.url db repair
More details and alternative repair options here:
Error Establishing a Database Connection: Database is Corrupt
For the one in a thousand where this doesn’t work, a backup restore would be the way to go.
IMPROVING MYSQL PERFORMANCE
A lot of performance issues can be traced to back database inefficiency. MyISAM is often a primary culprit and is an older, less efficient, and less reliable database storage engine than the more modern InnoDB.
MyISAM will lock whole database tables, which can have a logjam effect on database queries, whereas InnoDB only has row-level locking which allows queries to process much faster. Converting MyISAM tables to InnoDB can result in huge improvements in response time and reduced server load, as well as prevent issues like table locking.
By default, vCanopy uses InnoDB, but older websites that have been imported sometimes use MyISAM, and sometimes websites will have a mix of both.
To learn how to check whether your websites have MyISAM tables and convert them to InnoDB, please see this article:
Freeing Up Disk Space
Letting your disk space fill up can have serious consequences. At best, MySQL will go down, and all your sites will go down with it. At worst, you’ll suffer irreversible MySQL damage. The latter scenario you’ll need to fall back to your server provider snapshot.
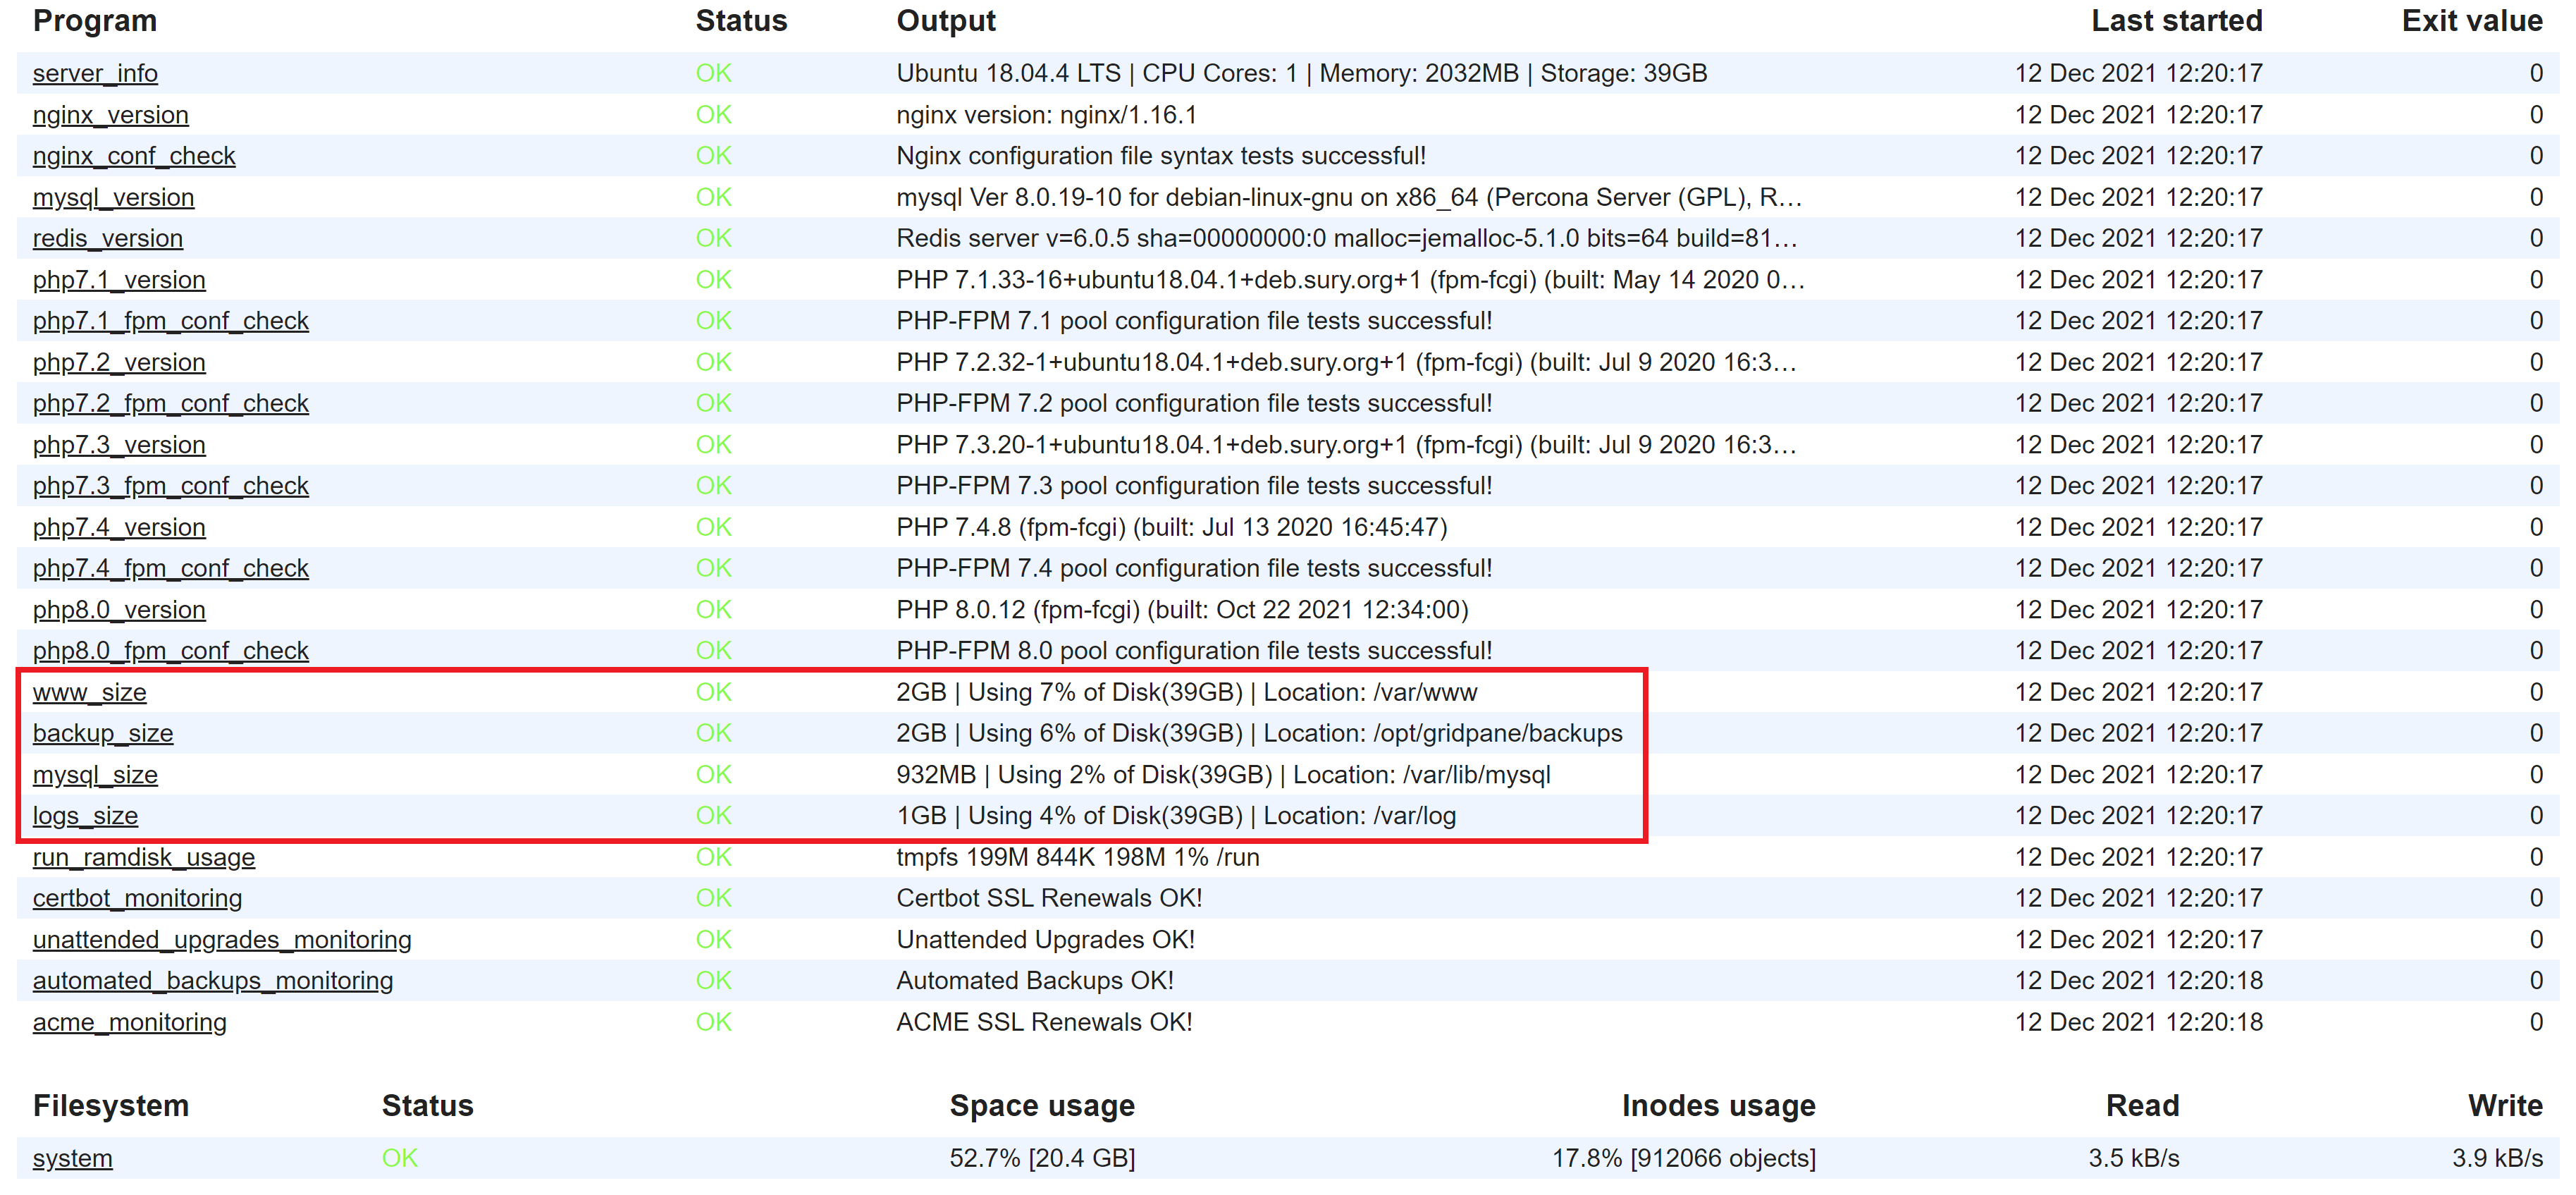
DISK SPACE CHECKS
First, you need to identify what’s taking up so much disk space. You’ll want to check: –
- Your backups
- Your websites /wp-content directory
- Your database sizes
- Server logs
- Site logs
Monit will provide a quick overview of where you should start:
CHECK YOUR WEBSITE DIRECTORIES
You can check which websites are the largest on your server by running:
cd /var/www
And then:
du -h --max-depth=1 | sort -h
When you identify the largest site, navigate to its directory with (switch out site.url with your websites actual URL):
cd /var/www/site.url/
Logs may be the cause – remove them if that’s the case. Also, turn off wp-debug to remove its log if it’s been active for some time.
You’ll like next navigate to /htdocs directory and then /wp-content and from there, plugin backups (which may have their own directory) are a common cause. Some optimization plugins can also have large caches.
CHECK YOUR DATABASE SIZES
Check your database sizes by first navigating to:
cd /var/lib/mysql
And then:
du -h --max-depth=1 | sort -h
CLEAN UP BACKUPS
Once you’ve identified the largest sites you may be able to clean up some space quickly by pruning some of their backups.
REMOVING FILES VIA SSH
Remove files with rm command. For example:
rm bigfile.zip
To remove files recursively (for example, if you need to delete an entire directory and its contents), use the -r flag like so:
rm -r backups-folder
You can learn more in this knowledge base article:
Troubleshooting High Disk Space Usage and Locating Large Files
Server is Overloaded
Using the sections detailed above, you’ll be able to determine whether your 502/504 errors are due to load
If you’re experiencing more load than the server can handle, then you likely need to upscale your server.
Before you do so:
- Make sure you’re using server caching – both page and object caching
- Make sure WPFail2Ban is enabled on your busiest sites
- Consider using Cloudflare
- Ensure your PHP worker settings aren’t misconfigured – set a max of 4 per vCPU core for the short term future
You’ve Been Hacked
Hacks are rare on vCanopy, and if you’re using our Fail2Ban integration and block wp-content php security measure, the chances of being hacked or suffering serious damage due to a hack are incredibly slim.
Troubleshooting and cleaning up hacked/infected sites can be difficult. Generally, a restore to a time where you know the site was healthy is the quickest way to get the site clean, and you can then immediately run your core, theme, and plugin updates.
SCANNERS
Tools like Maldet, MalCare, Wordfence, etc are only as good as the databases that power them, and no database is ever complete.
That said, if you suspect one of your sites has been infected, Wordfence’s free scanner is probably the best available – you may want to run it alongside Maldet. MalCare is also great.
We also have this article that may be helpful:
Moving a Website that’s had a malware infection
BOTNETS
Generally, botnets are composed of compromised sites, and the sites themselves are compromised by automated tools. A lot of the time this can be due to weak passwords or leaked passwords (I would definitely recommend a password audit on these sites and turning on our Fail2Ban integration), other times it’s zero-day exploits in a plugin.
They can also be very difficult to troubleshoot because attackers will upload a file, run it so that it starts off running in memory, and then delete it, so scanners aren’t able to identify it because technically there is no longer any malicious file.
Server Provider Attack Warnings: How to Find Brute Force Malware