


vCanopy Server Logs
These logs contain information relating to your server as a whole.
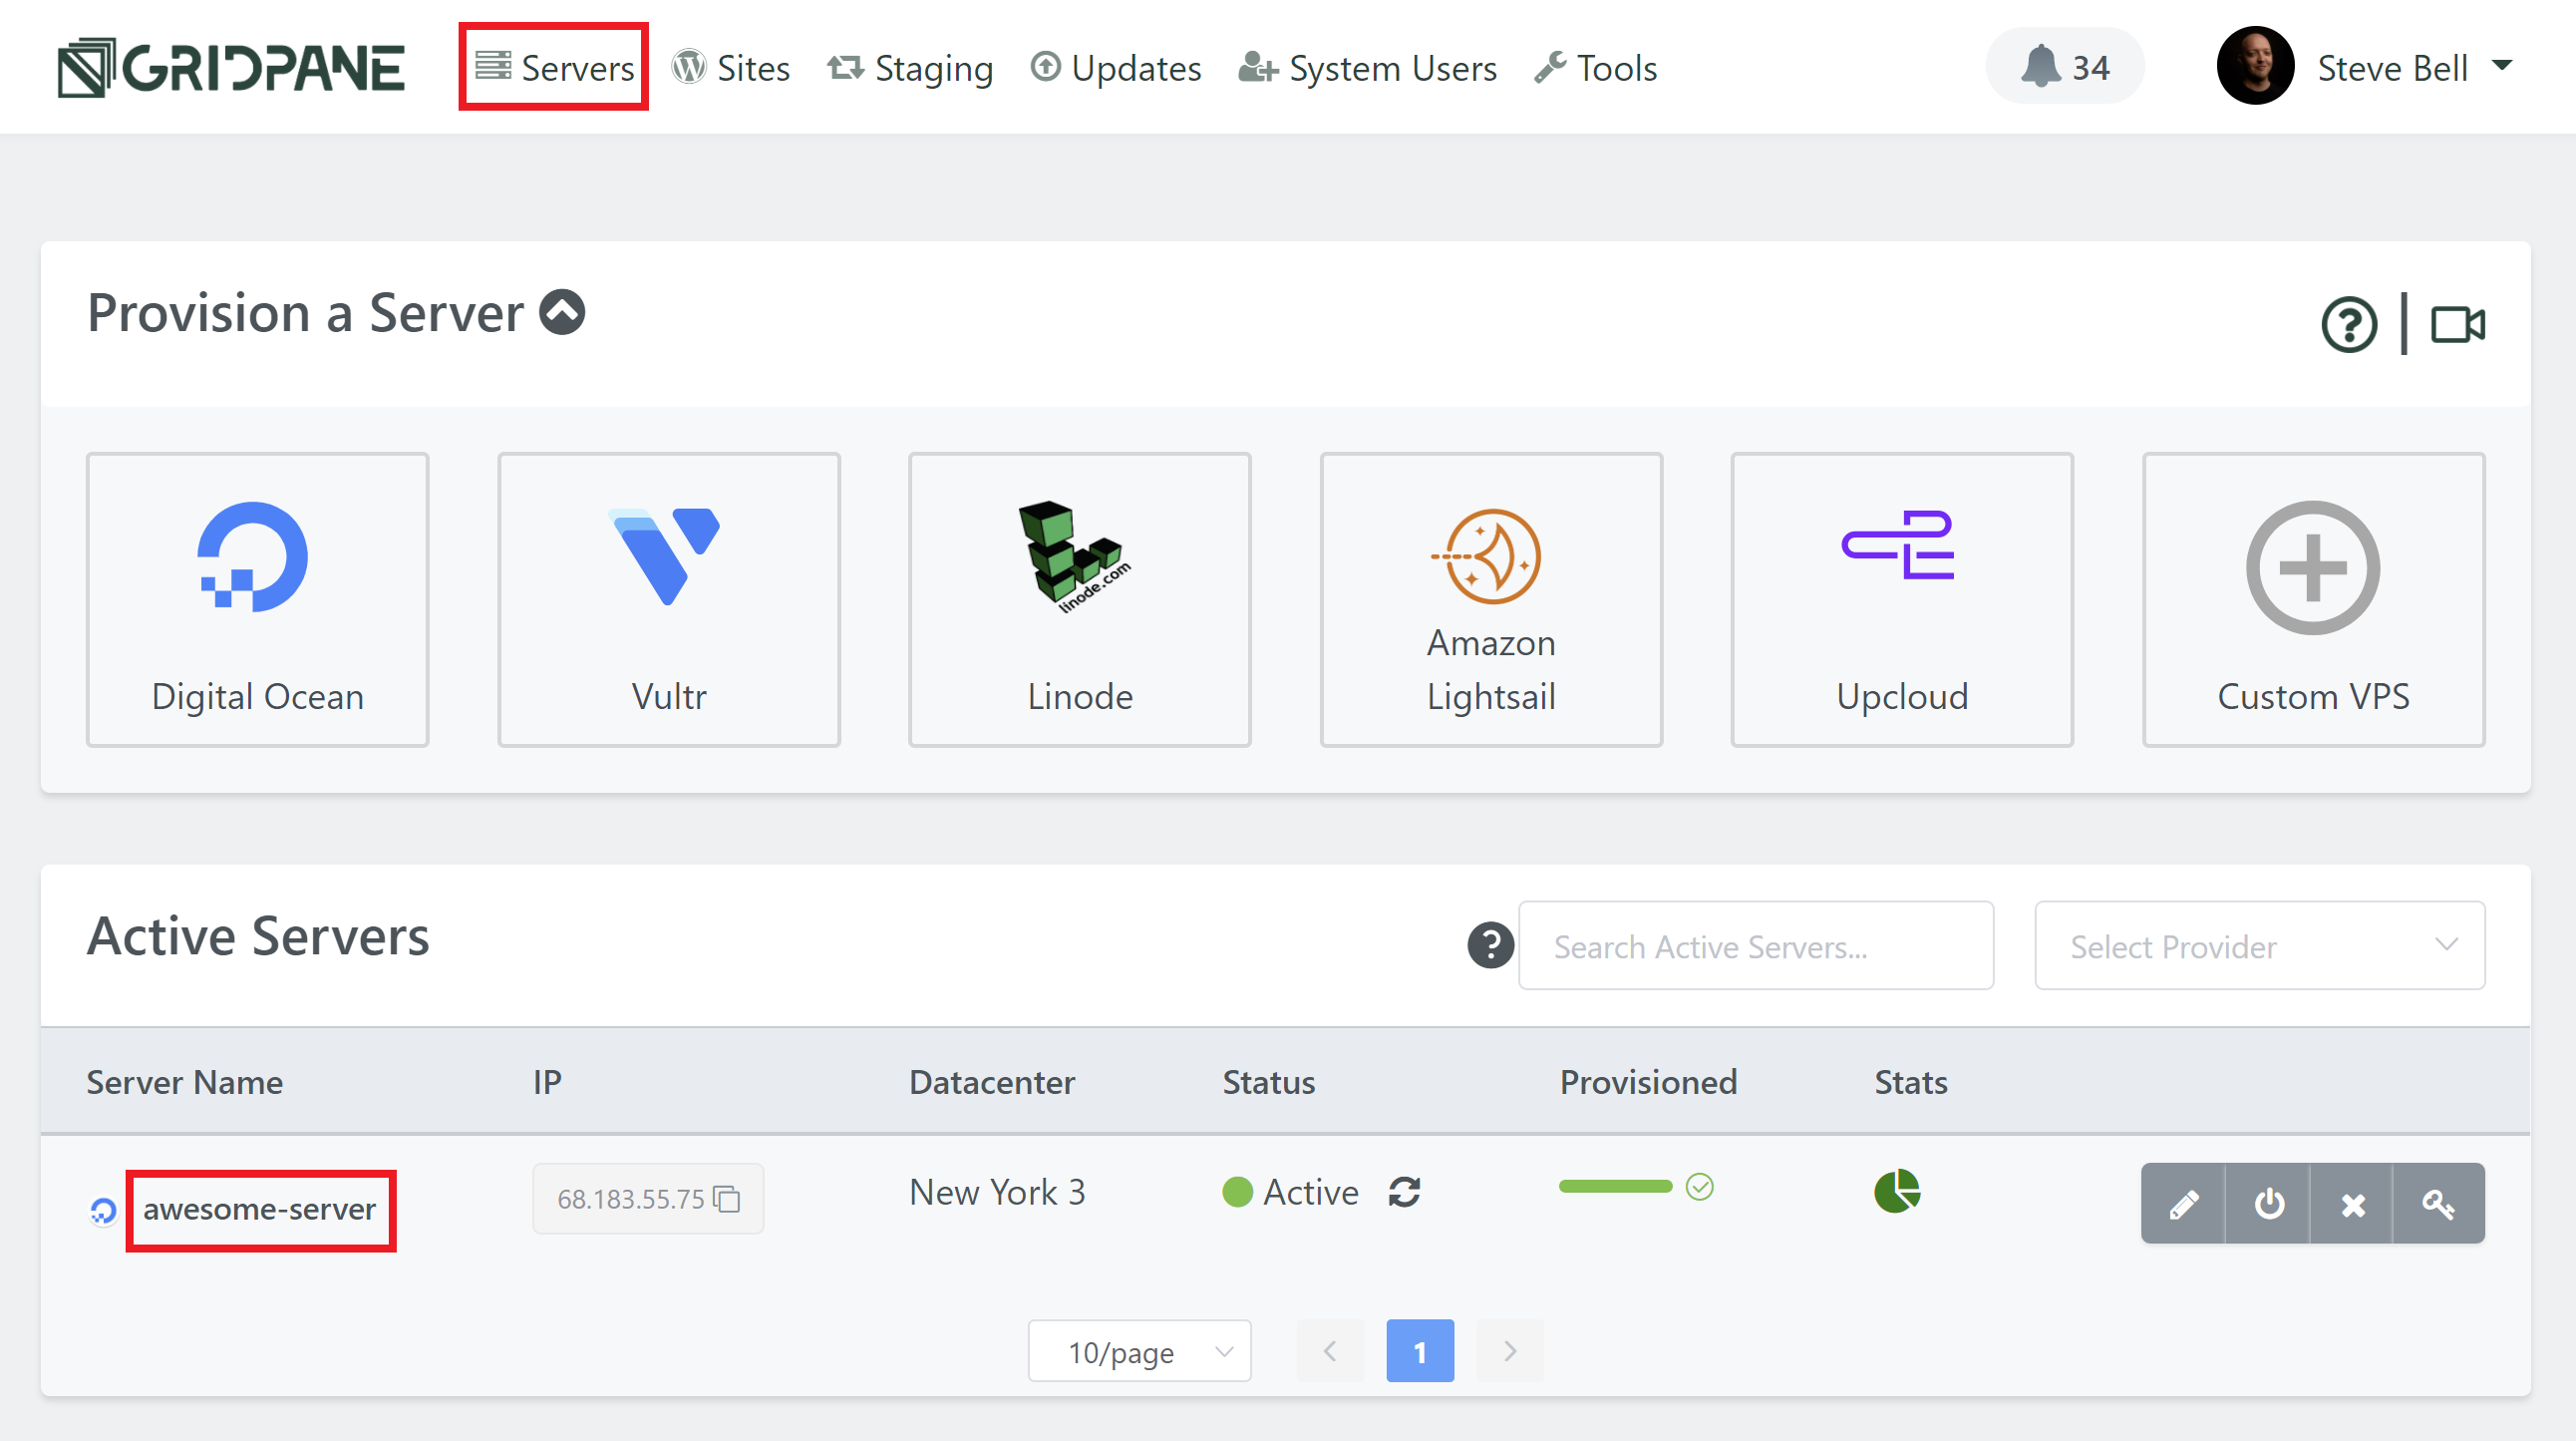
You can view your server logs by heading to the Servers page inside your vCanopy account, and clicking on the name of your server.
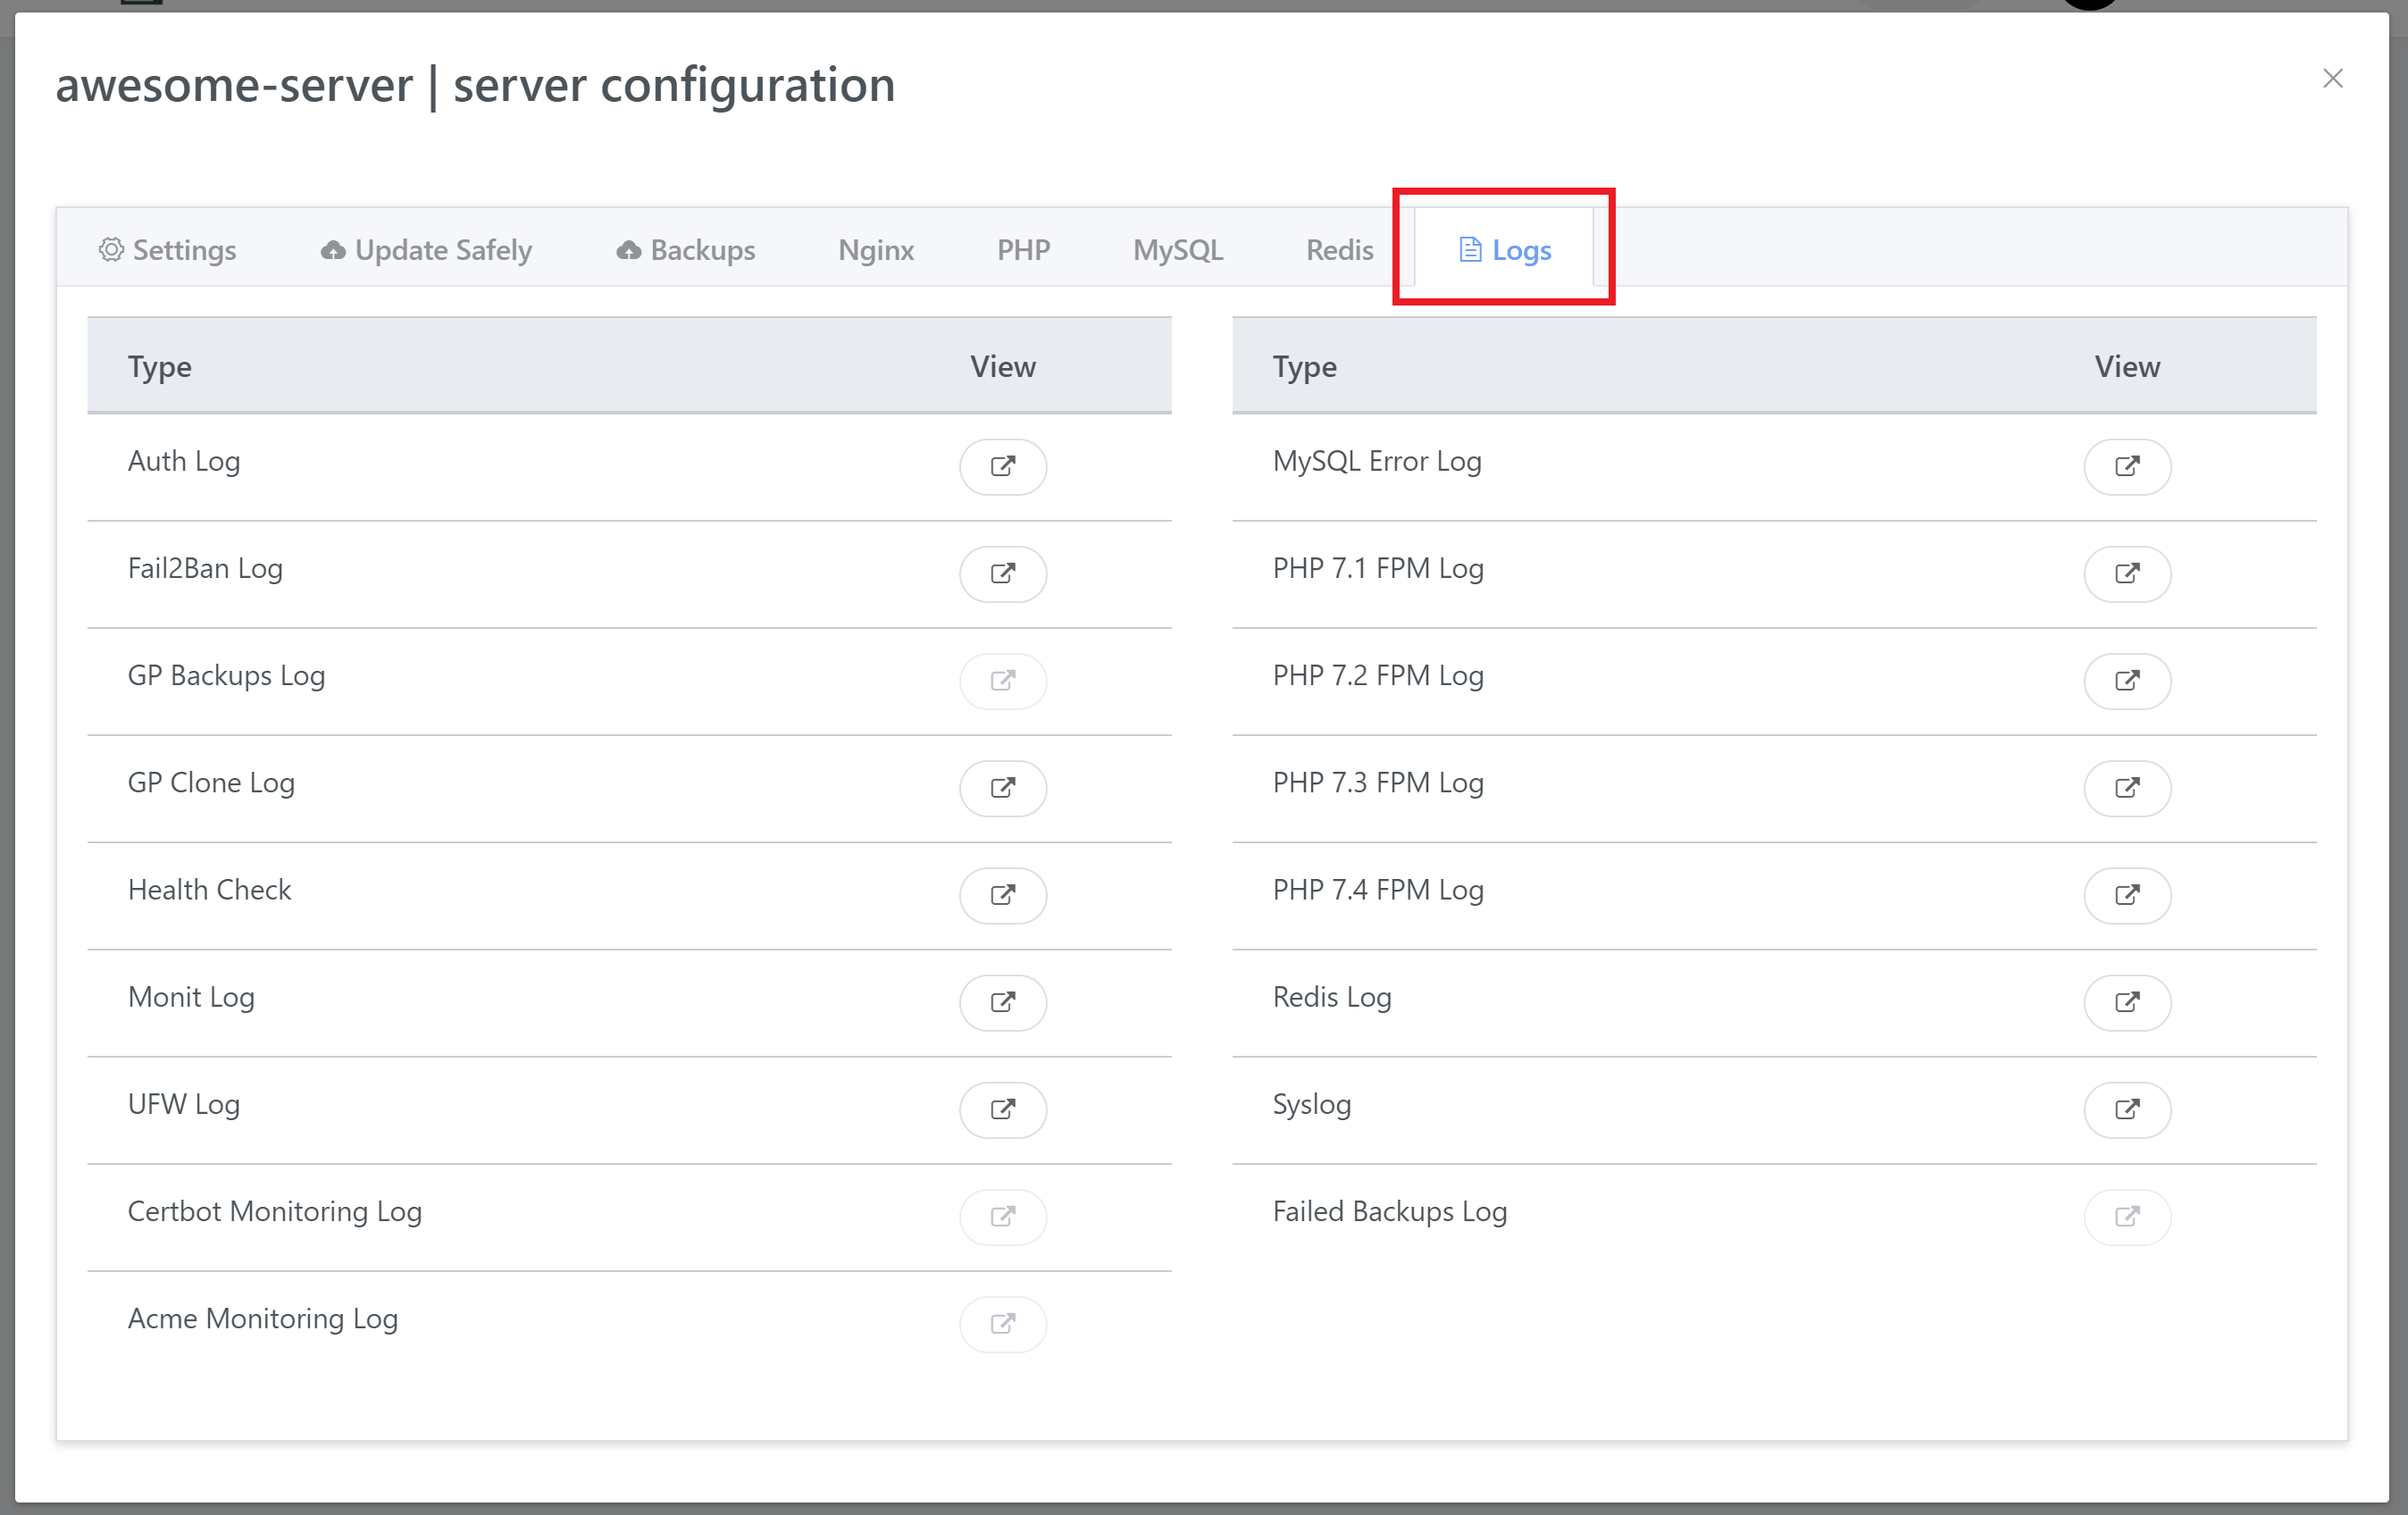
This will open up the server customizer modal as shown in the image below, and the logs are contained in the Logs tab. To open up a log, simply click on the icon next to the log name in the view column.
AUTH LOG
The auth log is responsible for logging all authentication-related events. You can use this log to view failed login attempts, identify brute force attacks, or anything that related to suspicious authentication attempts.
Server Location
The log can be found here when accessing your server via SSH or SFTP as the Root user:
/var/log/php/auth.log
FAIL2BAN LOG
The Fail2Ban log is responsible for logging all Fail2Ban related events. Here you can check on IPs that have been banned/unbanned. You’ll notice a lot of “Found”, which means these IPs are logged, but not exceeding the thresholds for bad behaviour that result in an actual ban.
Server Location
The log can be found here when accessing your server via SSH or SFTP as the Root user:
/var/log/fail2ban.log
GP CLONE LOG
The vCanopy Clone Log keeps track of all website cloning events. If you clone any of the websites on your server, it will be logged here. If you experienced a cloning failure, you can check this log for details of what may have gone wrong.
Server Location
The log can be found here when accessing your server via SSH or SFTP as the Root user:
/opt/vCanopy/gpclone.log
HEALTH CHECK LOG
The Health Check Log will be created when you run your first server health check. It will perform a series of checks on your server and then give it a score. You can use the information in this log to help determine when it’s time to scale up, free up disk space, and spot/diagnose other potential issues that could cause or be causing your websites issues. It can take several minutes to complete, and will then display the results directly in the log.Server LocationThe log can be found here when accessing your server via SSH or SFTP as the Root user:
/var/log/health-check.log
MONIT LOG
The Monit Log keeps track of events related to the services it monitors. Here you’ll see when Monit detects errors and restarts services them to keep your server fully operational. If you’re experiencing issues specific to a service (Nginx, MySQL, PHP, Redis), you’ll be able to get a good look at what’s going on inside your server with this log.Server LocationThe log can be found here when accessing your server via SSH or SFTP as the Root user:
/var/log/monit.log
UFW LOG
UFW stands for Uncomplicated Firewall. It’s a program for managing a netfilter firewall. While “uncomplicated” is true in it’s setup, reading the logs is actually a little complicated. For a thorough walkthrough on how to make sense of the events in this log, this answer on AskUbuntu gives a step by step explanation.
It’s unlikely you will ever need to check this log, however, we include it here to be thorough and make access to it easy for veteran Sysadmins.Server LocationThe log can be found here when accessing your server via SSH or SFTP as the Root user:
/var/log/ufw_log
CERTBOT MONITORING LOG
The Certbot Monitoring Log keeps track of SSL certificate renewals for SSL’s that were provisioned using the webroot method – the website is not using a DNS API integration, and was provisioned after the DNS records were changed. If you’ve had a notice about an SSL certificate failing to renew, this log will provide the answers as to why it failed.
Server LocationThe log can be found here when accessing your server via SSH or SFTP as the Root user:
/opt/vCanopy/certbot.monitoring.log
ACME MONITORING LOG
The Acme Monitoring Log keeps track of SSL certificate renewals for SSL’s that were provisioned using the DNS API Full method, or API Challenge method. It’s extremely rare that SSL’s provisioned this way later fail, but should you have any trouble this log will provide insight into what’s happened.
Server LocationThe log can be found here when accessing your server via SSH or SFTP as the Root user:
/opt/vCanopy/acme.monitoring.log
MYSQL ERROR LOG
The MySQL Error Log keeps track of startup and shutdown times, and any errors that may occur during this process. They also log if any tables need to be checked/repaired. If you’re experiencing any database related issues on any of your sites, you may find helpful info in this log.Server LocationThe log can be found here when accessing your server via SSH or SFTP as the Root user:
/var/log/mysql/error.log
PHP 7.1 FPM LOG (NGINX)
The PHP 7.1 FPM Log probably isn’t going to be a log you’ll ever need to view. It’s here while we still offer support for PHP 7.1, but you should look at upgrading to 7.3 or 7.4 ASAP. This log keeps track of PHP 7.1 startup and restart events.Server LocationThe log can be found here when accessing your server via SSH or SFTP as the Root user:
/var/log/php/7.1/fpm.log
PHP 7.2 FPM LOG (NGINX)
The PHP 7.2 FPM Log keeps track of PHP 7.2 startup and restart events.Server LocationThe log can be found here when accessing your server via SSH or SFTP as the Root user:
/var/log/php/7.2/fpm.log
PHP 7.3 FPM LOG (NGINX)
The PHP 7.3 FPM Log keeps track of PHP 7.3 startup and restart events.
Server LocationThe log can be found here when accessing your server via SSH or SFTP as the Root user:
/var/log/php/7.3/fpm.log
PHP 7.4 FPM LOG (NGINX)
The PHP 7.4 FPM Log keeps track of PHP 7.4 startup and restart events.
Server LocationThe log can be found here when accessing your server via SSH or SFTP as the Root user:
/var/log/php/7.4/fpm.log
PHP 8.0 FPM LOG (NGINX)
The PHP 8.0 FPM Log keeps track of PHP 8.0 startup and restarts events.
Server LocationThe log can be found here when accessing your server via SSH or SFTP as the Root user:
/var/log/php/8.0/fpm.log
REDIS LOG
The Redis Log keeps track of all Redis related events being saved on your server. This includes shutdowns, restarts, and memory usage.Server LocationThe log can be found here when accessing your server via SSH or SFTP as the Root user:
/var/log/redis/redis-server.log
SYSLOG
Syslog can actually refer to a few different things – the syslog service, the syslog protocol, and/or a syslog message. For our purposes here, this log is a system related events log.
If you’d like to dig deeper into the Linux Syslog, this article over at Loggly.com is a good place to start:
https://www.loggly.com/ultimate-guide/linux-logging-basics/
It’s unlikely you will ever need to check this log, however, we include it here to be thorough and make access to it easy for veteran Sysadmins.
Server LocationThe log can be found here when accessing your server via SSH or SFTP as the Root user:
/var/log/syslog
AUTOMATED BACKUPS MONITORING LOG
The vCanopy Backups log keeps track of all the website backups that take place on your server. If you want to check when specific websites are being backed up, they will be detailed in this log.
Server LocationThe log can be found here when accessing your server via SSH or SFTP as the Root user:
/opt/vCanopy/backups.monitoring.log
OPENLITESPEED STDERR.LOG (NOT AVAILABLE IN UI)
The stderr.log is only accessible via the command line at this time. This log is usually the most helpful when determining why PHP is throwing 503 errors.Server LocationThe log can be found here when accessing your server via SSH or SFTP as the Root user:
/usr/local/lsws/logs/stderr.log
OPENLITESPEED WEB SERVER ERROR.LOG (NOT AVAILABLE IN UI)
The web server error log may provide helpful hints as to whether the web server caused PHP to fail.
Server LocationThe log can be found here when accessing your server via SSH or SFTP as the Root user:
/usr/local/lsws/logs/error.log
As an additional note, the following can be useful for diagnosing 503 errors. However, most of the time, the error log doesn’t give you the reason why the 503 error happened. It only shows you when it happened and with which domain it happened.
grep oops /usr/local/lsws/logs/error.log
GIT ERROR LOG
The Git Error Log records any Git specific errors that may have taken place.
Server LocationThe log can be found here when accessing your server via SSH or SFTP as the Root user:
/opt/vCanopy/git.error.log
MySQL Slow Log
The MySQL slow query log is where the MySQL database server will log all queries that exceed the time (in seconds) that you specify. This can be particularly helpful on database-intensive websites, such as WooCommerce stores, to help identify long-running processes, and fix them for better performance. You can learn more about using the MySQL Slow Log here:
VIEW THE LOG
On Developer and Agency accounts, the MySQL slow log can be activated and viewed within the UI. It’s located within the Server customizer inside the MySQL tab:
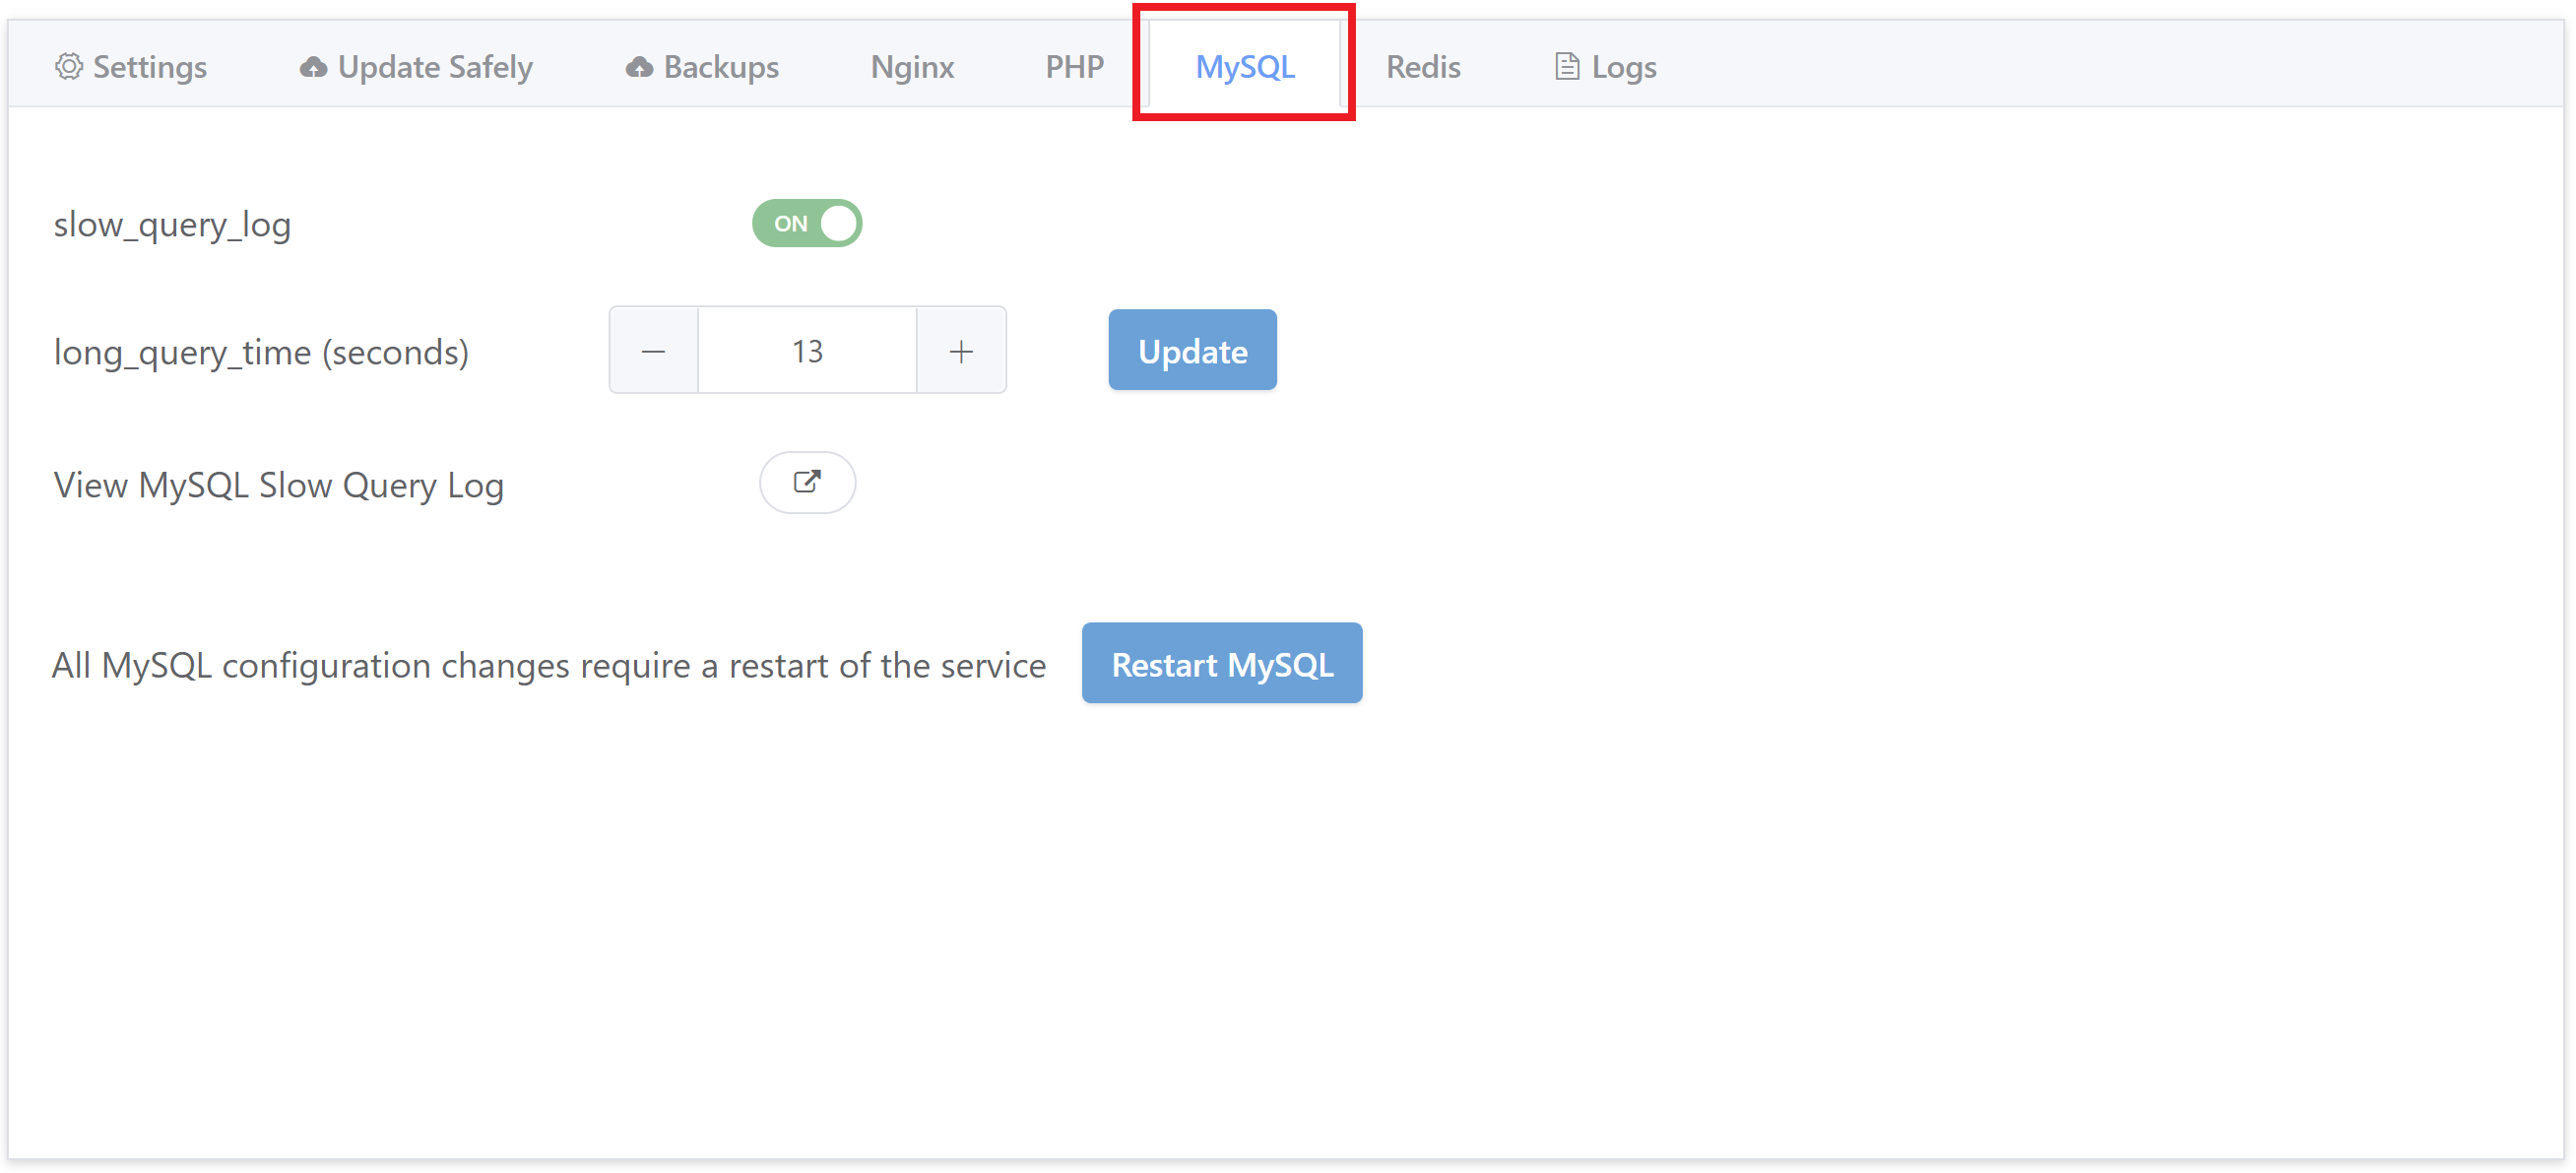
Click the View MySQL Slow Query Log button to display the log.
SLOW LOG SERVER LOCATION
The log can be found here when accessing your server via SSH or SFTP as the Root user:
/var/log/mysql/error.log
Website Specific Logs
Your website specific logs are going to be the first place you head to in many instances if/when you need to start diagnosing any issues that occur. The SSL provision log and the Nginx site error log in particular will be of great help in diagnosing SSL and performance related issues. Our support team may also ask you to provide us with information from these logs if you reach out to us for assistance.
You can view your website specific logs heading to the Sites page inside your vCanopy account, and clicking on the name of your website.
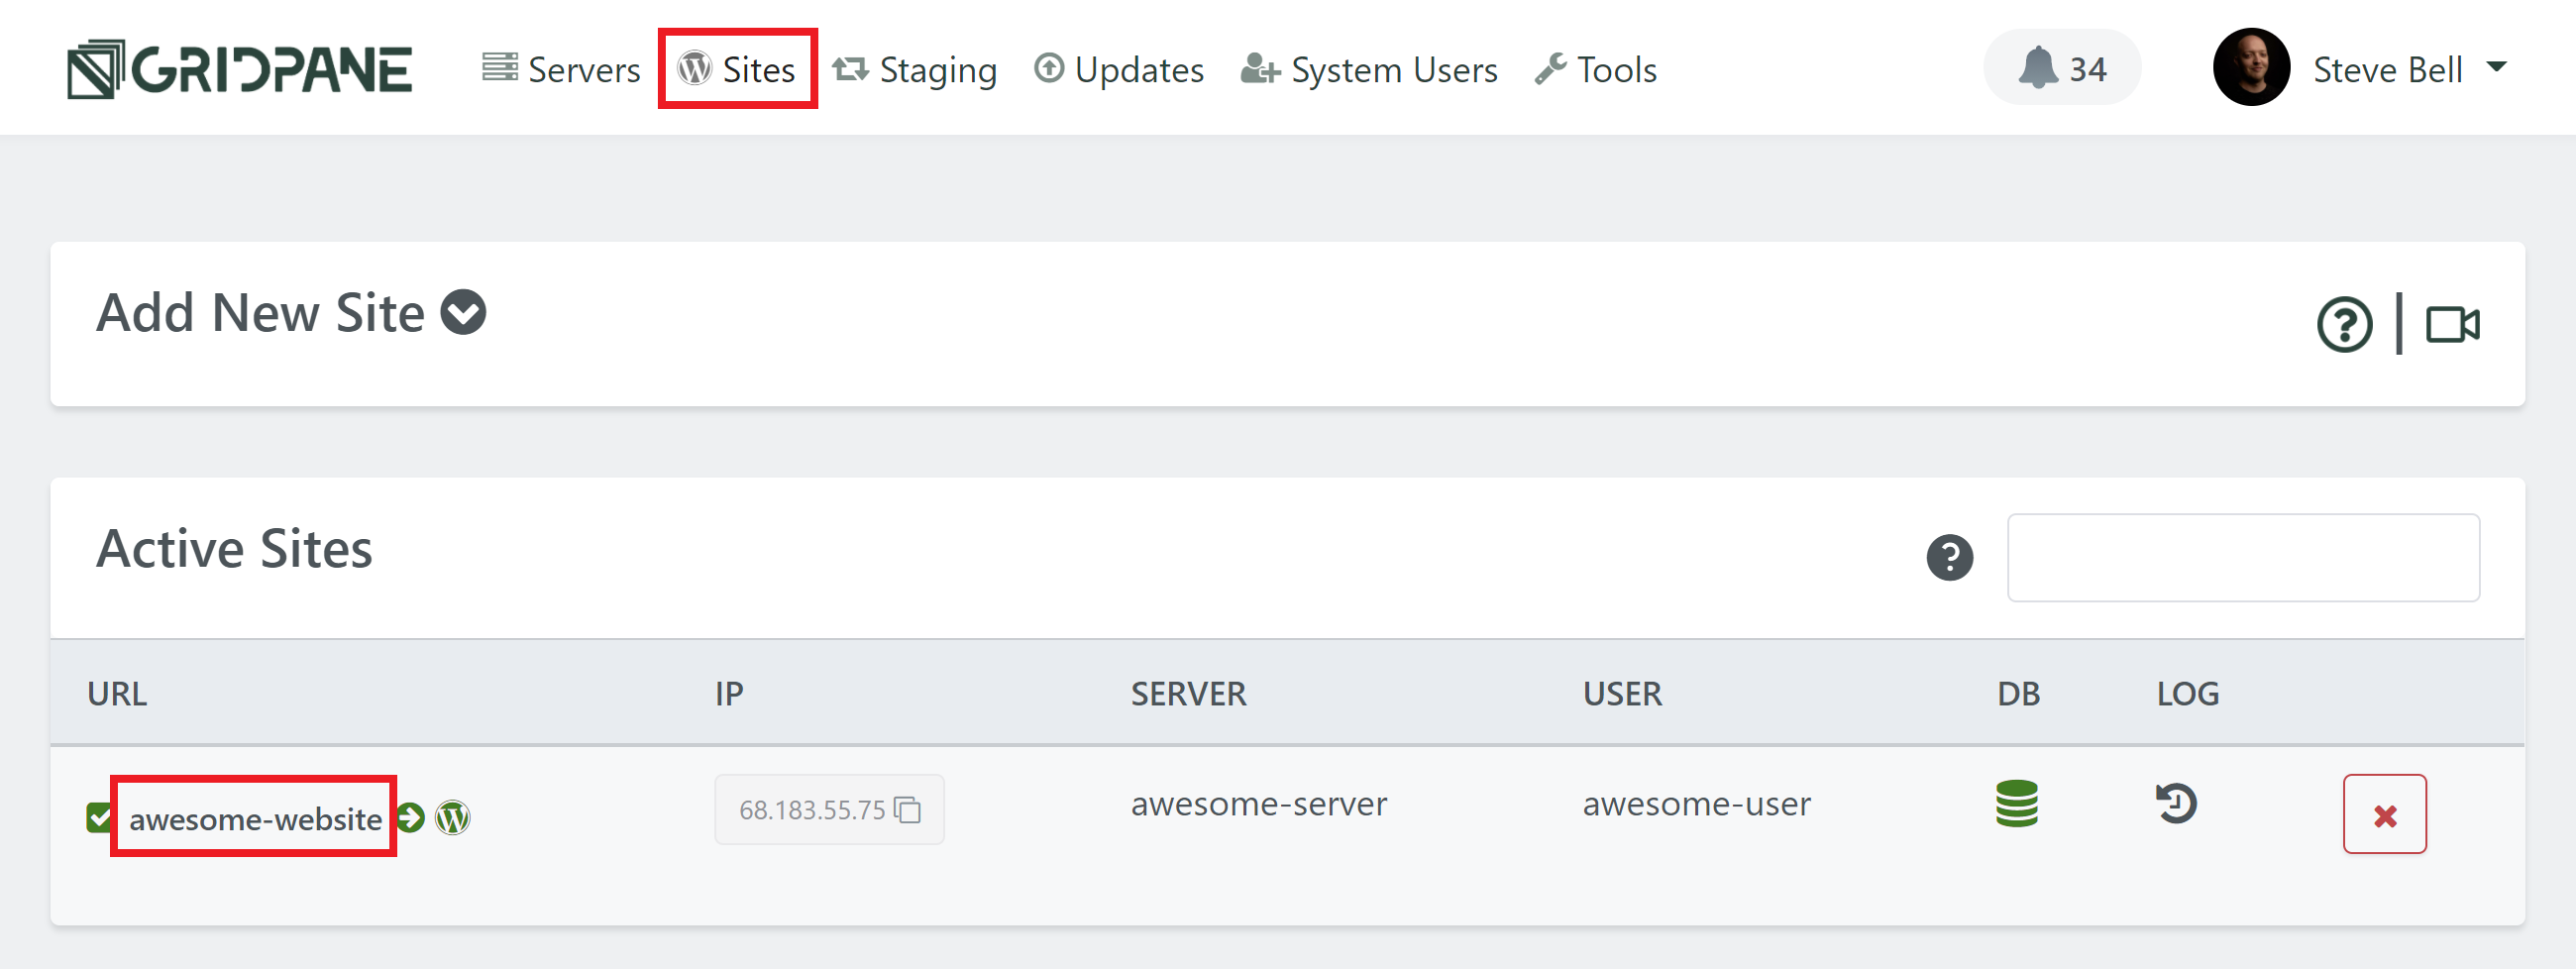
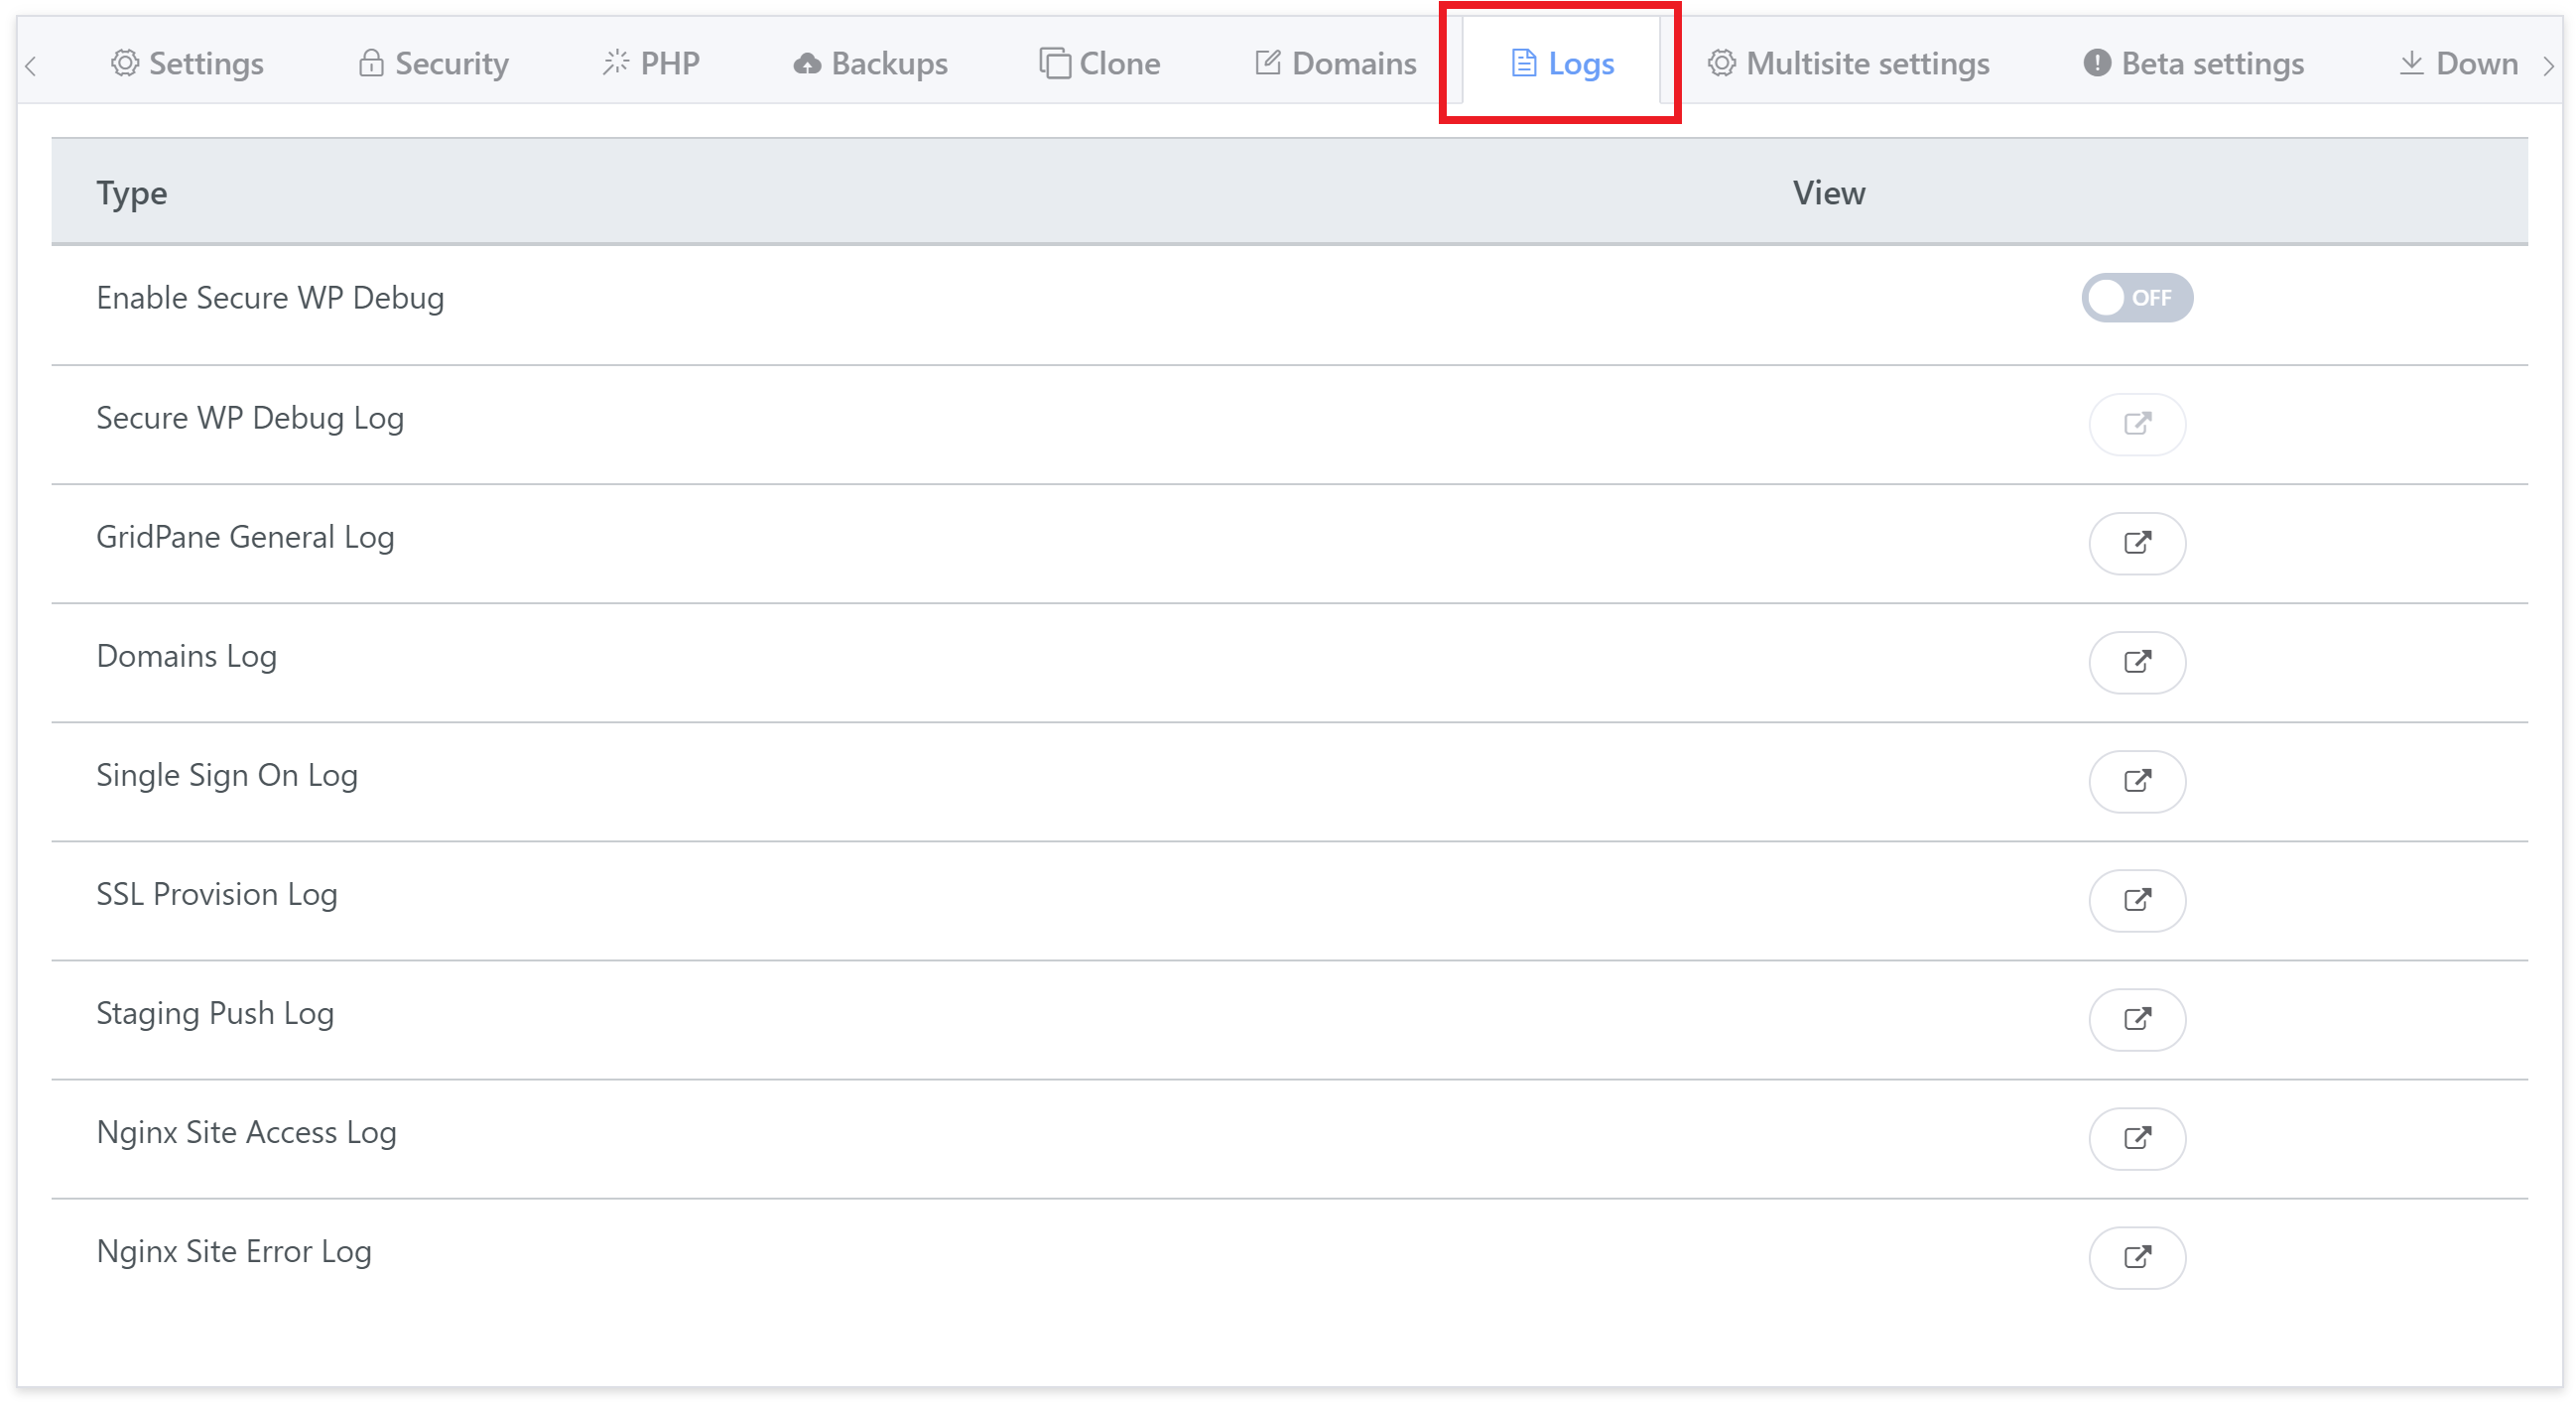
This will open up the website configuration/customizer modal, and the logs are contained in the Logs tab.
PHP Slow Log
The PHP slow log, like the MySQL slow query log, is useful for diagnosing long-running processes that are having a negative effect on your website’s performance. Learn more here:
VIEW THE PHP SLOW LOG
For Developer and Agency accounts, you can view the PHP Slow Log directly inside the UI. The PHP Slow log is located in the website configuration modal, inside the PHP tab:
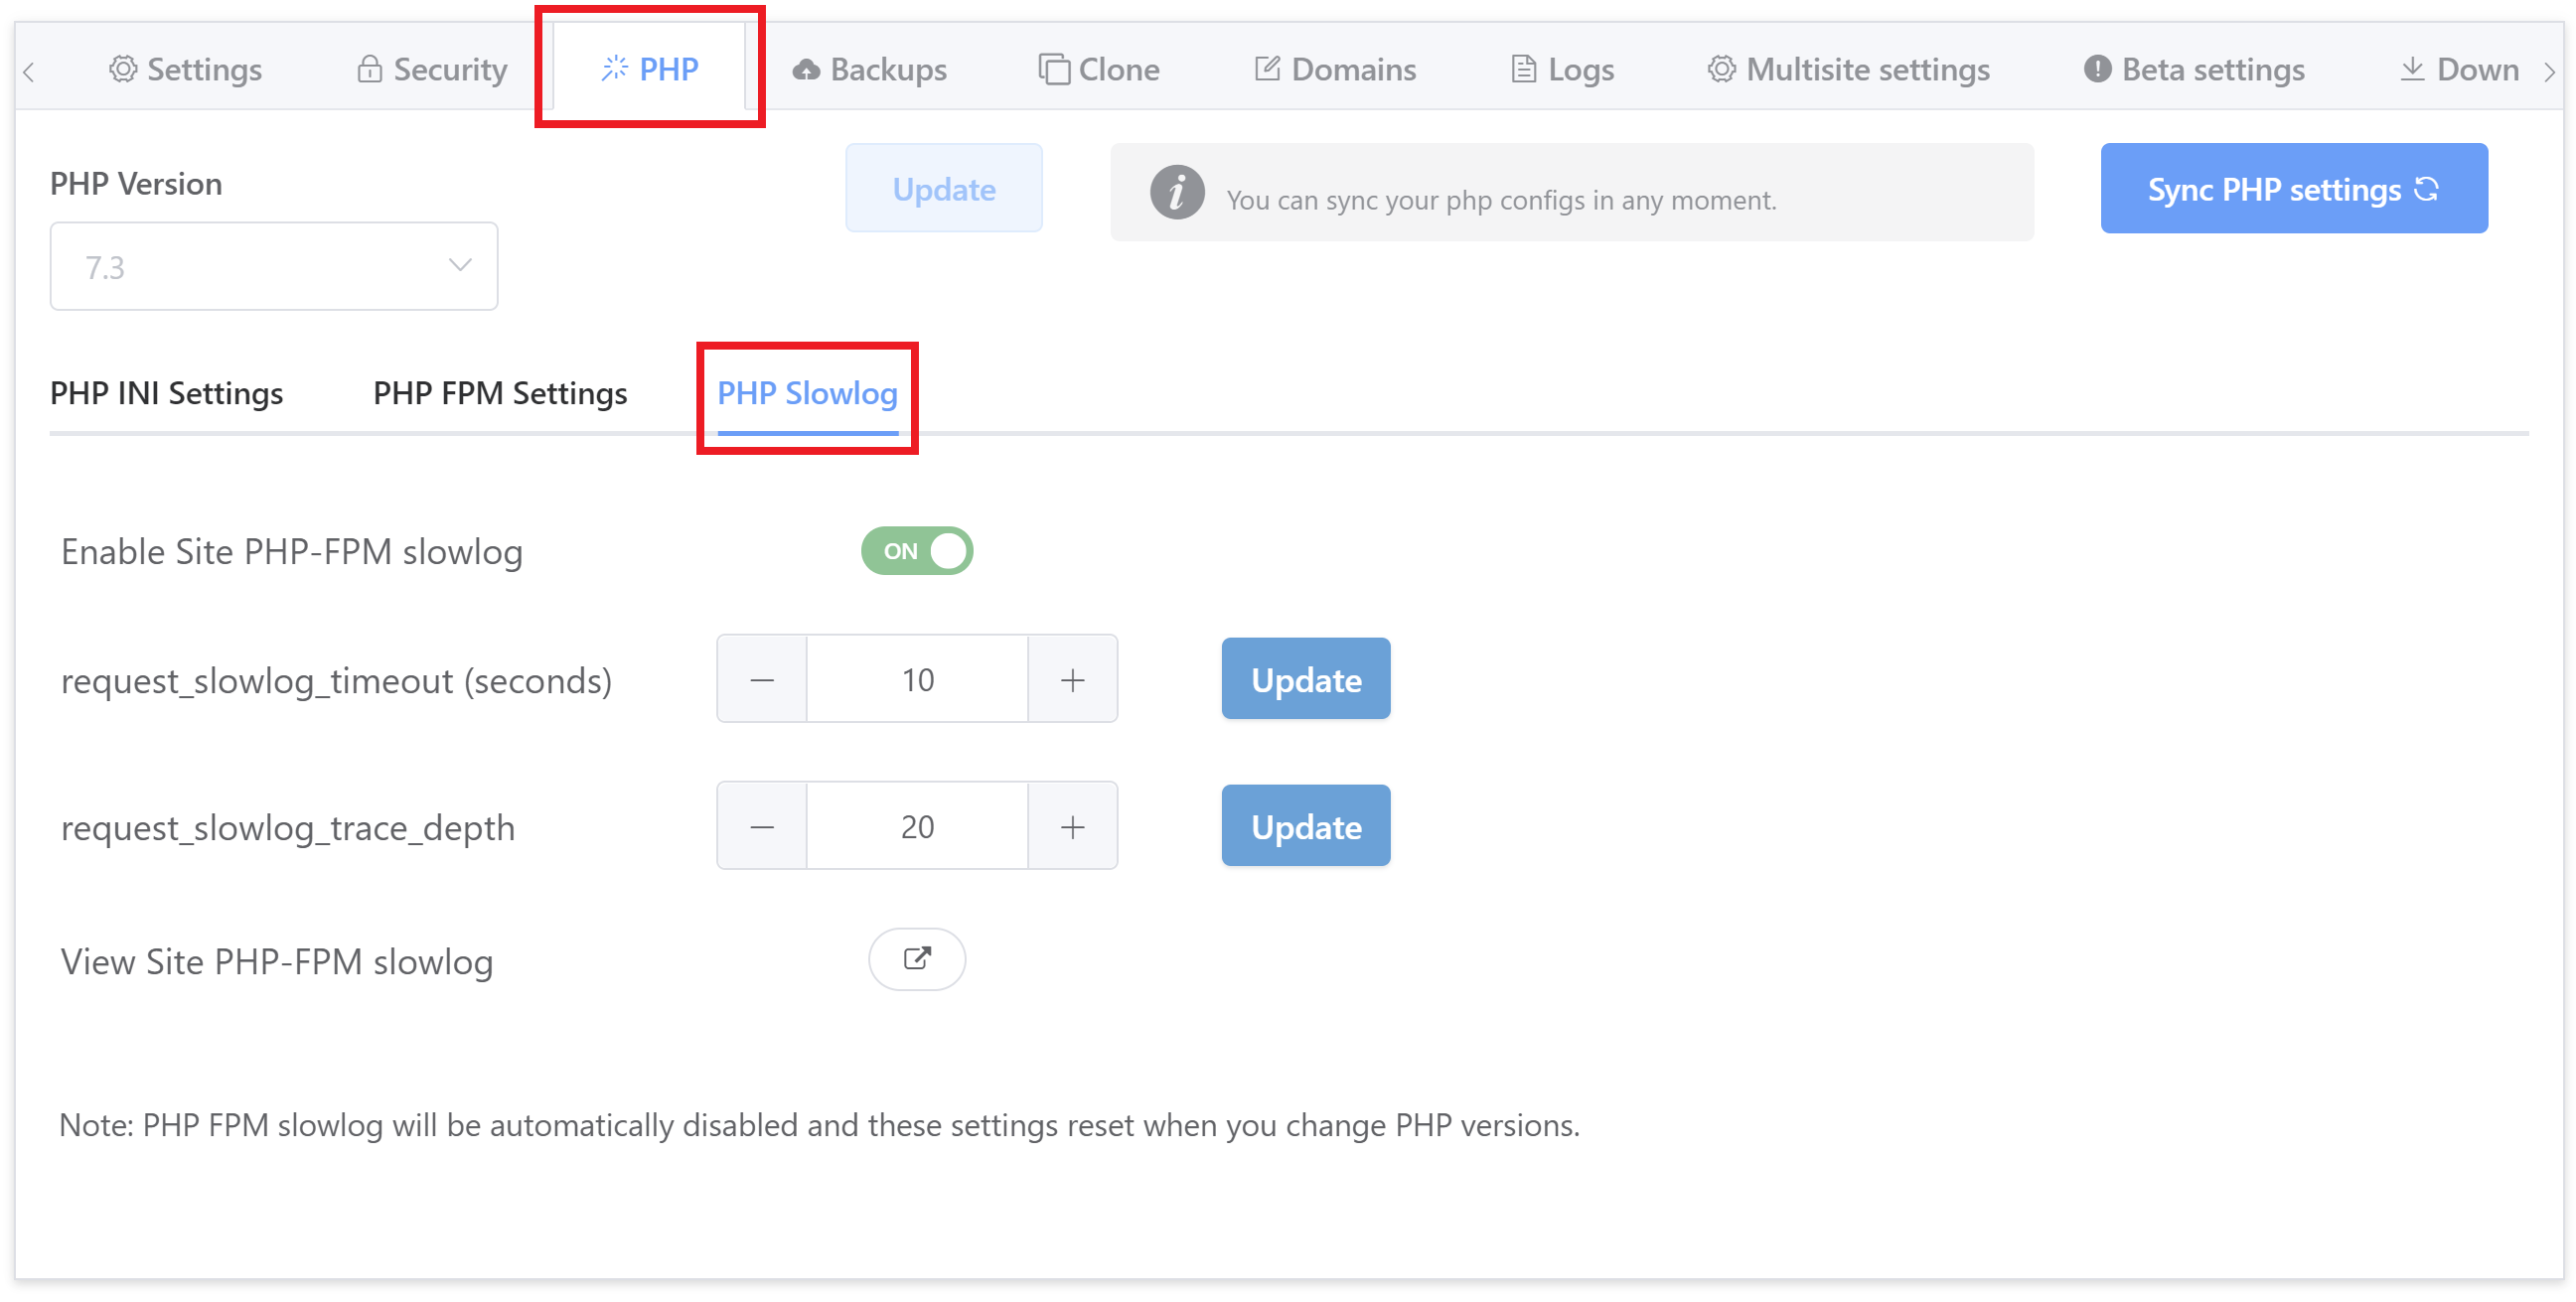
Click the button next to “View Site PHP-FPM slowlog” to display the contents of the log.
SERVER LOCATION
The log name will vary depending on which version of PHP you’re using, but it will be located in /var/log. The log will be your websites name, followed by the PHP version without the “.” between the two numbers.
Here’s an example for PHP 7.3:
/var/log/site.url73.log.slow