


1. Check Monit
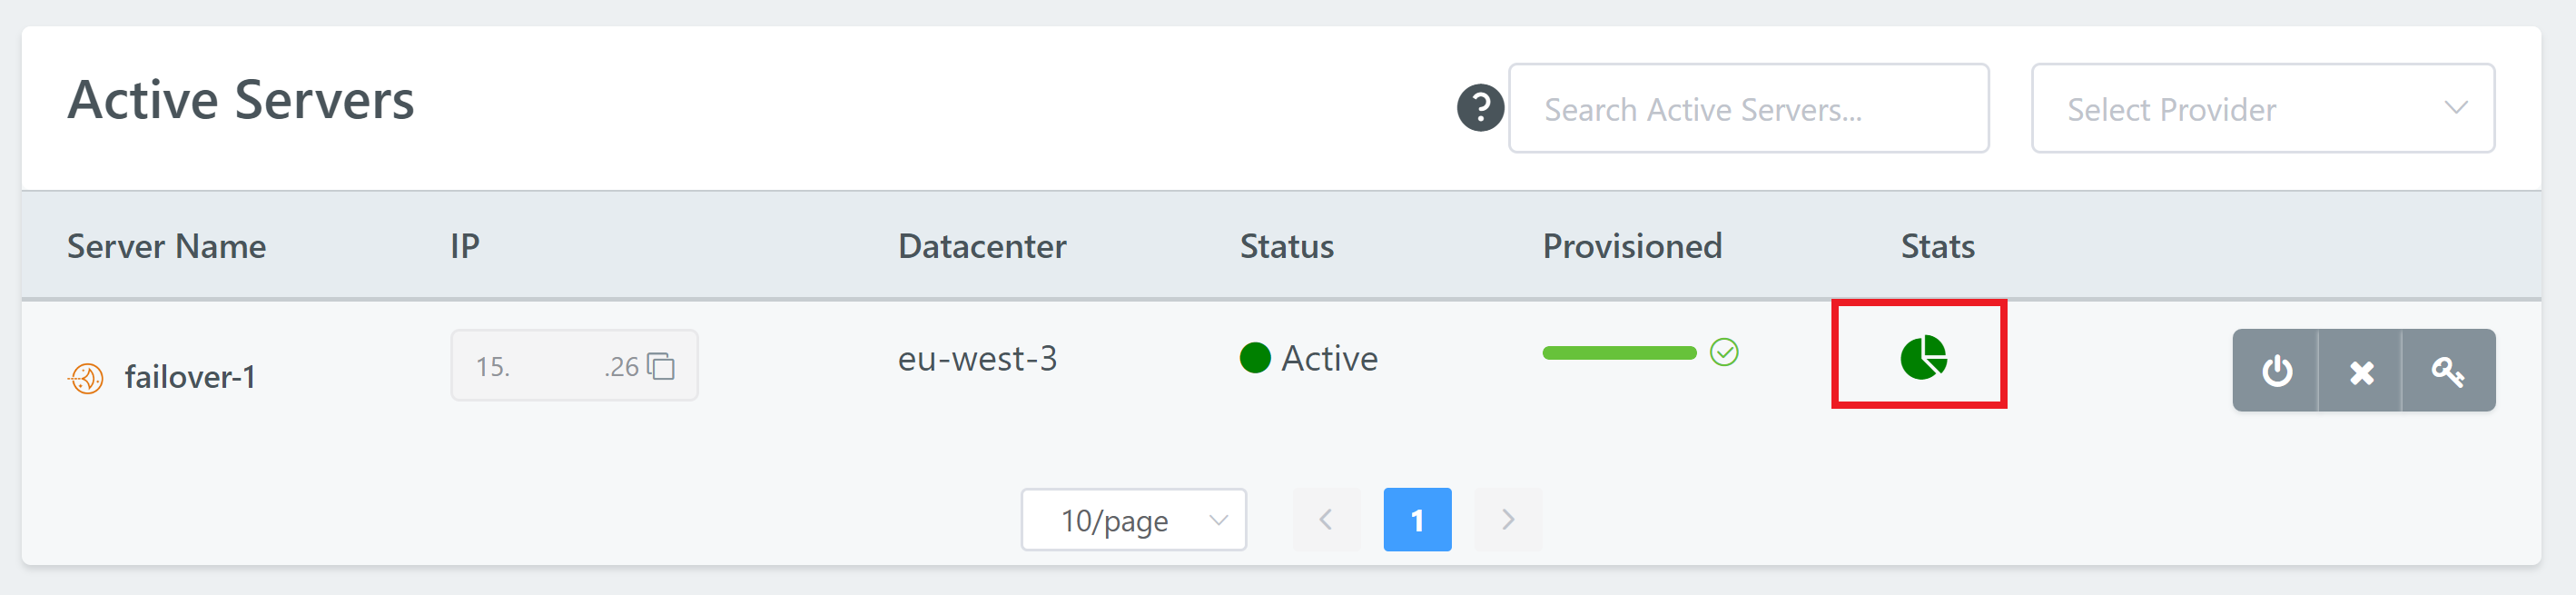
First, head to your Servers page in your account and open up Monit for the server you’re having trouble with by clicking on the pie chart icon:
Does the server look healthy? Here we’re looking for anything highlighted in red, and specifically at the CPU and RAM usage at the very top. Here’s a healthy example:
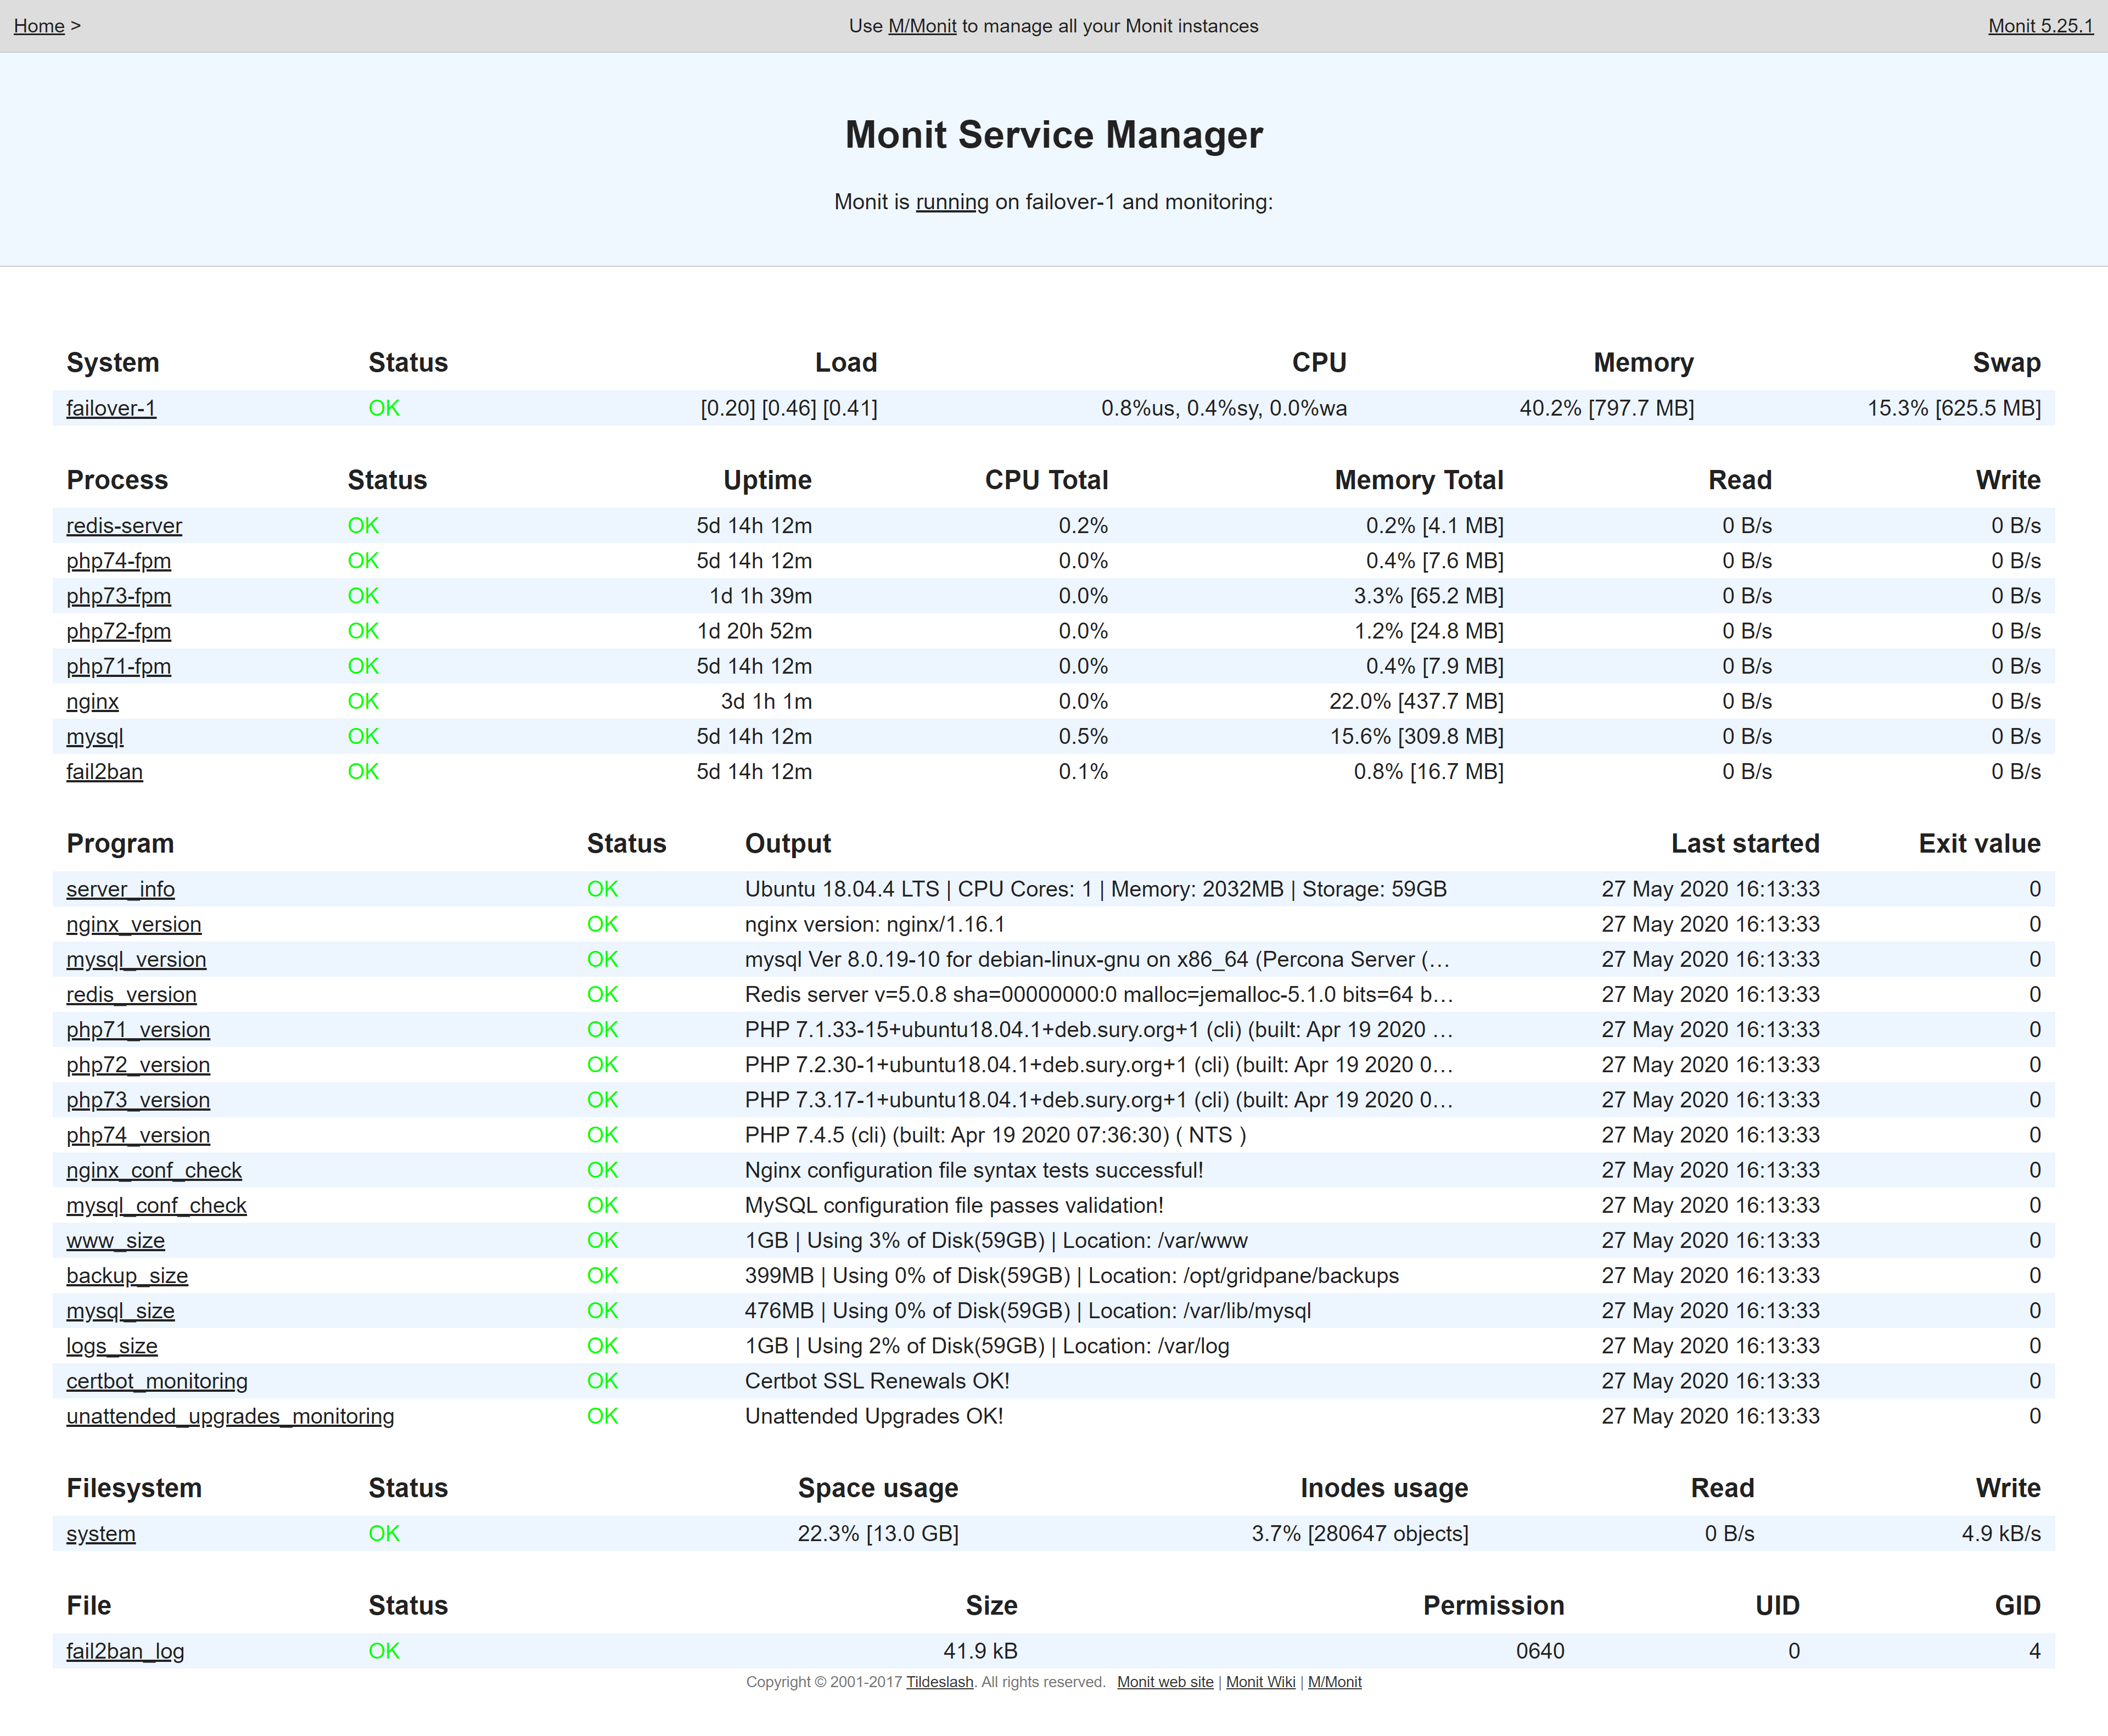
This will tell you a lot about what’s going on inside your server.
Here you need to determine whether or not you have the resources available for your server to run efficiently. If your server is all green and your CPU and RAM seem fine, then it’s likely going to be one of the following:
- Locked database tables,
- Codebase errors
- An issue with your CDN/Proxy service
- A caching issue (your cache needs clearing)
FILESYSTEM: SPACE USAGE IS ABOVE 90%
A common thing we see is disk space being over 90% full and starving the server’s processes of memory, which in turn causes temporary 504 errors.
Space usage is the amount of available disk space on your server. If it’s in the red, you may need to clean up some space or resize your server to the next size up.
This is likely the cause of your problem.
SYSTEM: HIGH CPU USAGE
Sustained high CPU usage means that your server is experiencing a heavy amount of processes, which could mean: –
- One or more of your websites is extremely busy (whether it be real traffic or bot traffic)
- You’re experiencing a DDOS or brute force attack
- You have noisy neighbours on your server that are stealing your resources
- You have slow running processes due to codebase/database issues or you’re running on swap, keeping the CPU forever busy
If you’re experiencing high CPU and RAM usage, proceed to step 4.
PROCESSES: NGINX, MYSQL OR PHP ARE BUSY
If one of your services is busy – e.g. your PHP version, Nginx, or MySQL, then this may be the root cause of your timeouts – the server is there, but visitors can’t retrieve any information because your services are locked up in other long running tasks.
These need to be fixed – either by restarting them, or allocating more memory to them so they can do what they need to do.
This is likely the cause of your problem.
SYSTEM: HIGH MEMORY USAGE
If there’s not enough free memory and/or your system is utilizing a lot of swap, this can slow loading your websites down to a crawl.
PHP worker misconfiguration is often a cause of this, but very large databases (or collectively large databases), misconfigured PHP INI settings, massive sites with huge FastCGI caches, sites that need A LOT of memory to function that are getting a lot of traffic.
2. Check top and htop
Here we want to check two things:
- Is your server experiencing steal? (Noisy neighbours)
- Is it clearly one website that’s bringing everything down?
The goal is to identify what service and/or websites are most active so that you know the next step to take in your troubleshooting.
For this you’ll need to SSH into your server. Please see the following articles to get started:
Step 1. Generate your SSH Key
Step 2. Add your SSH Key to vCanopy (also see Add default SSH Keys)
Step 3. Connect to your server by SSH as Root user (we like and use Termius)
CHECKING FOR CPU STEAL AND IOWAIT WITH TOP
The top command will let you know if other VPS’s on your server are stealing your CPU usage, or if your CPU is waiting on IO/drives. Run:
top
And you’ll see a table appear that looks as follows. We’re interested in the parts highlighted in red:
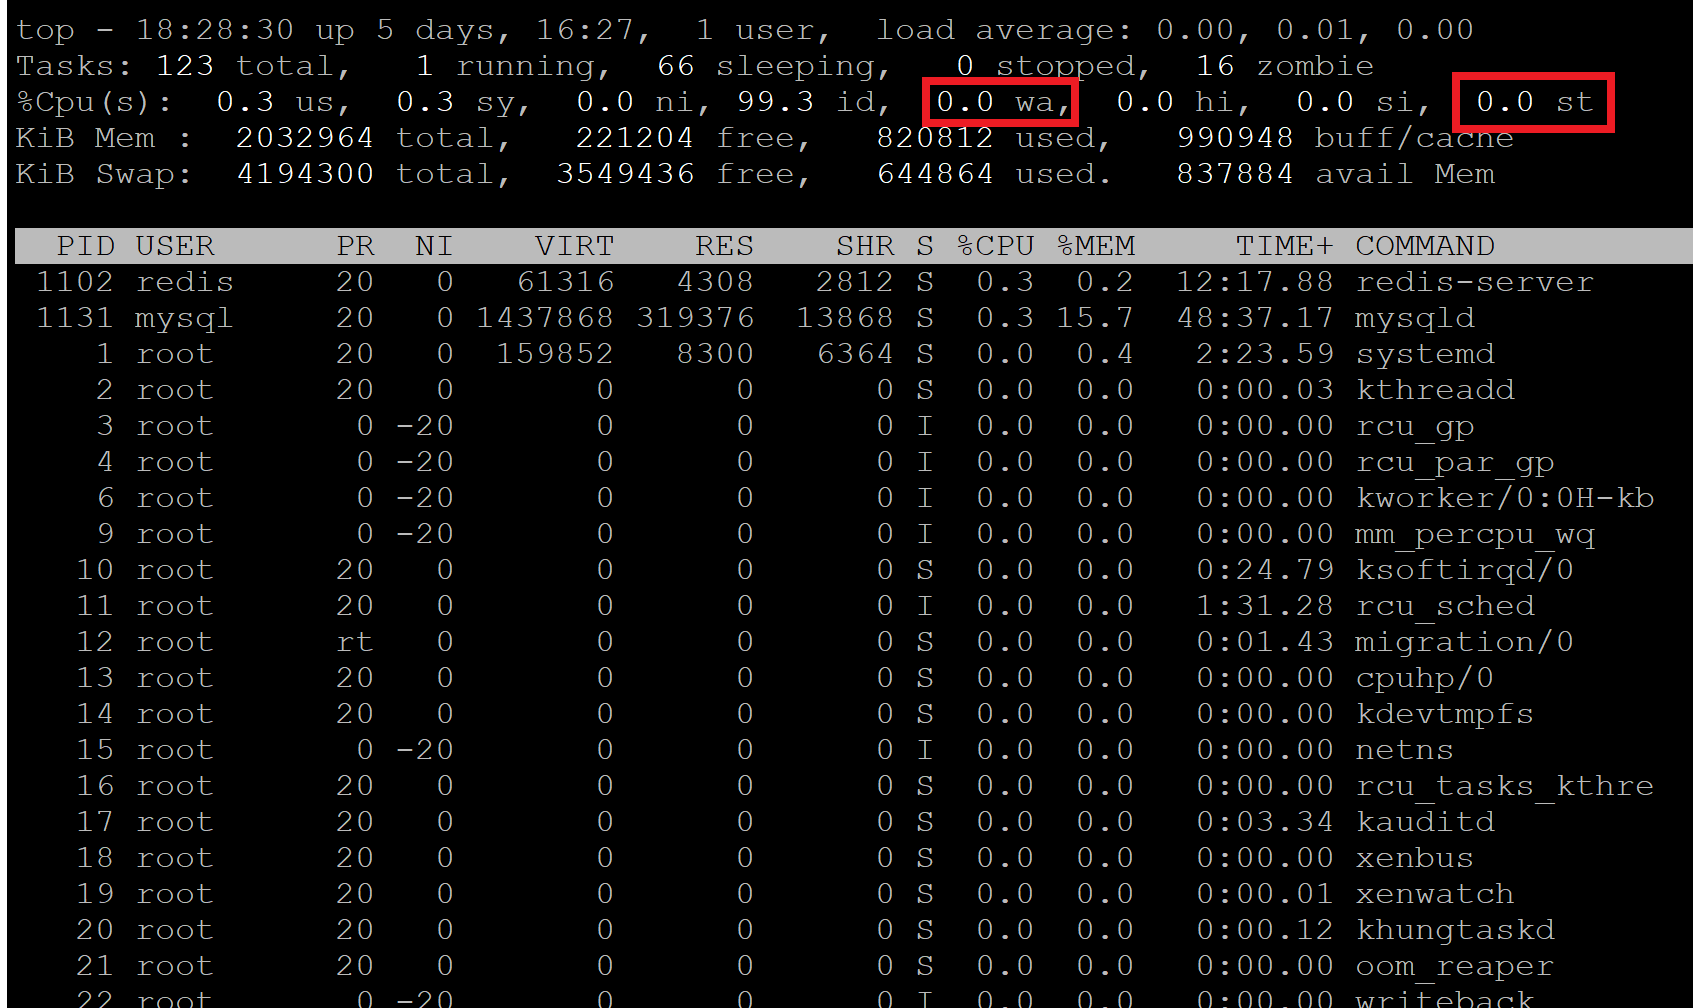
Steal “st”
Here you can see there’s no steal, but sometimes neighbours on your server can potentially steal a lot of your CPU – sometimes over 50% or more.
If you’re experiencing server steal then you need to contact you IaaS provider directly to let them know what’s going on so they can take action accordingly.
I/O Wait “wa”
If this is high then the CPU is waiting on the IO/drives. You can exit top and install run iotop to see which process is causing the most I/O utilization on your server.
To exit top hit Ctrl+C.
You can install iotop with:
apt install iotop
Then run:
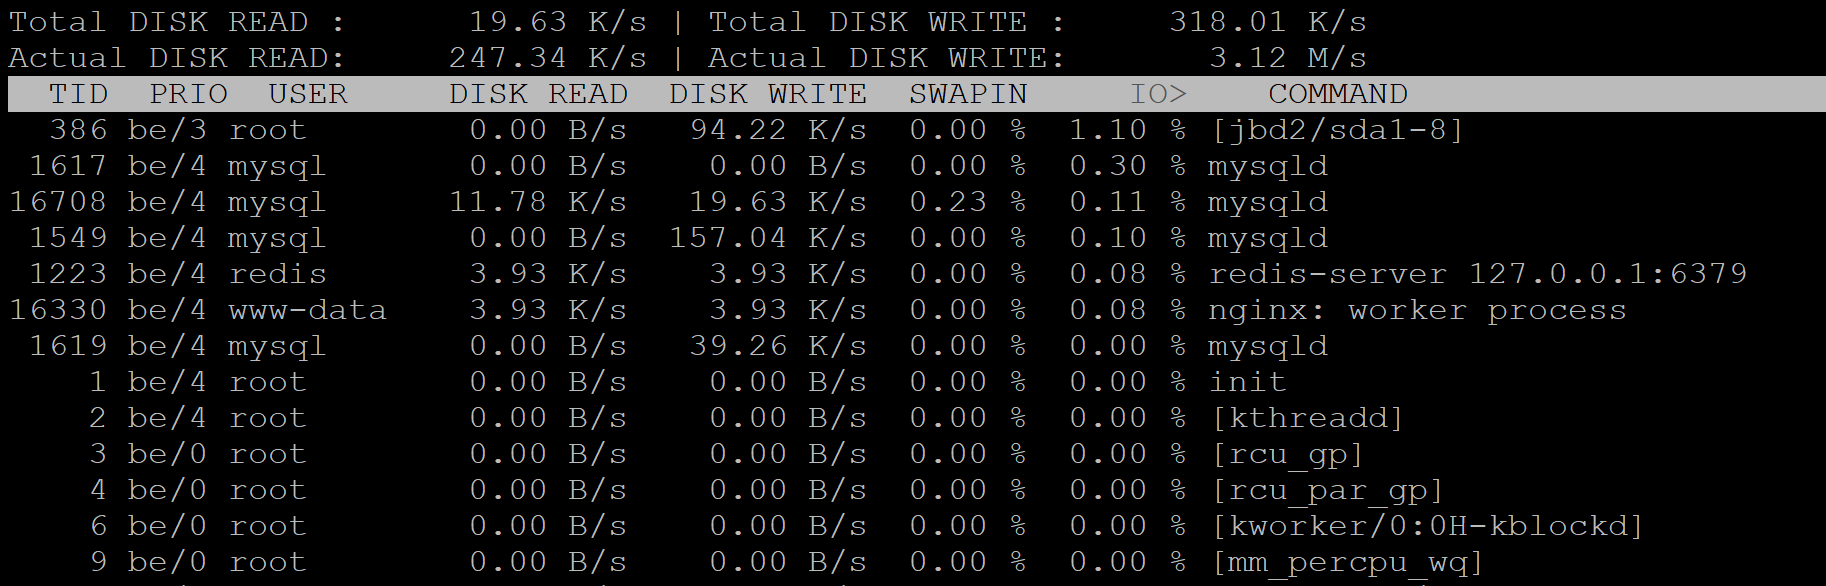
iotop
iotop will list all of the processes running with the heaviest process at the very top.
If your steal and wait time are clear, then proceed below. To exit top/iotop hit Ctrl+C.
CHECKING ACTIVE PROCESSES WITH HTOP
The information presented by htop will identify the processes responsible for high resource usage on the server. By default, processes are sorted by CPU usage – the highest at user at the very top of the table. To get started run:
htop
This will open up a table that looks like the following:
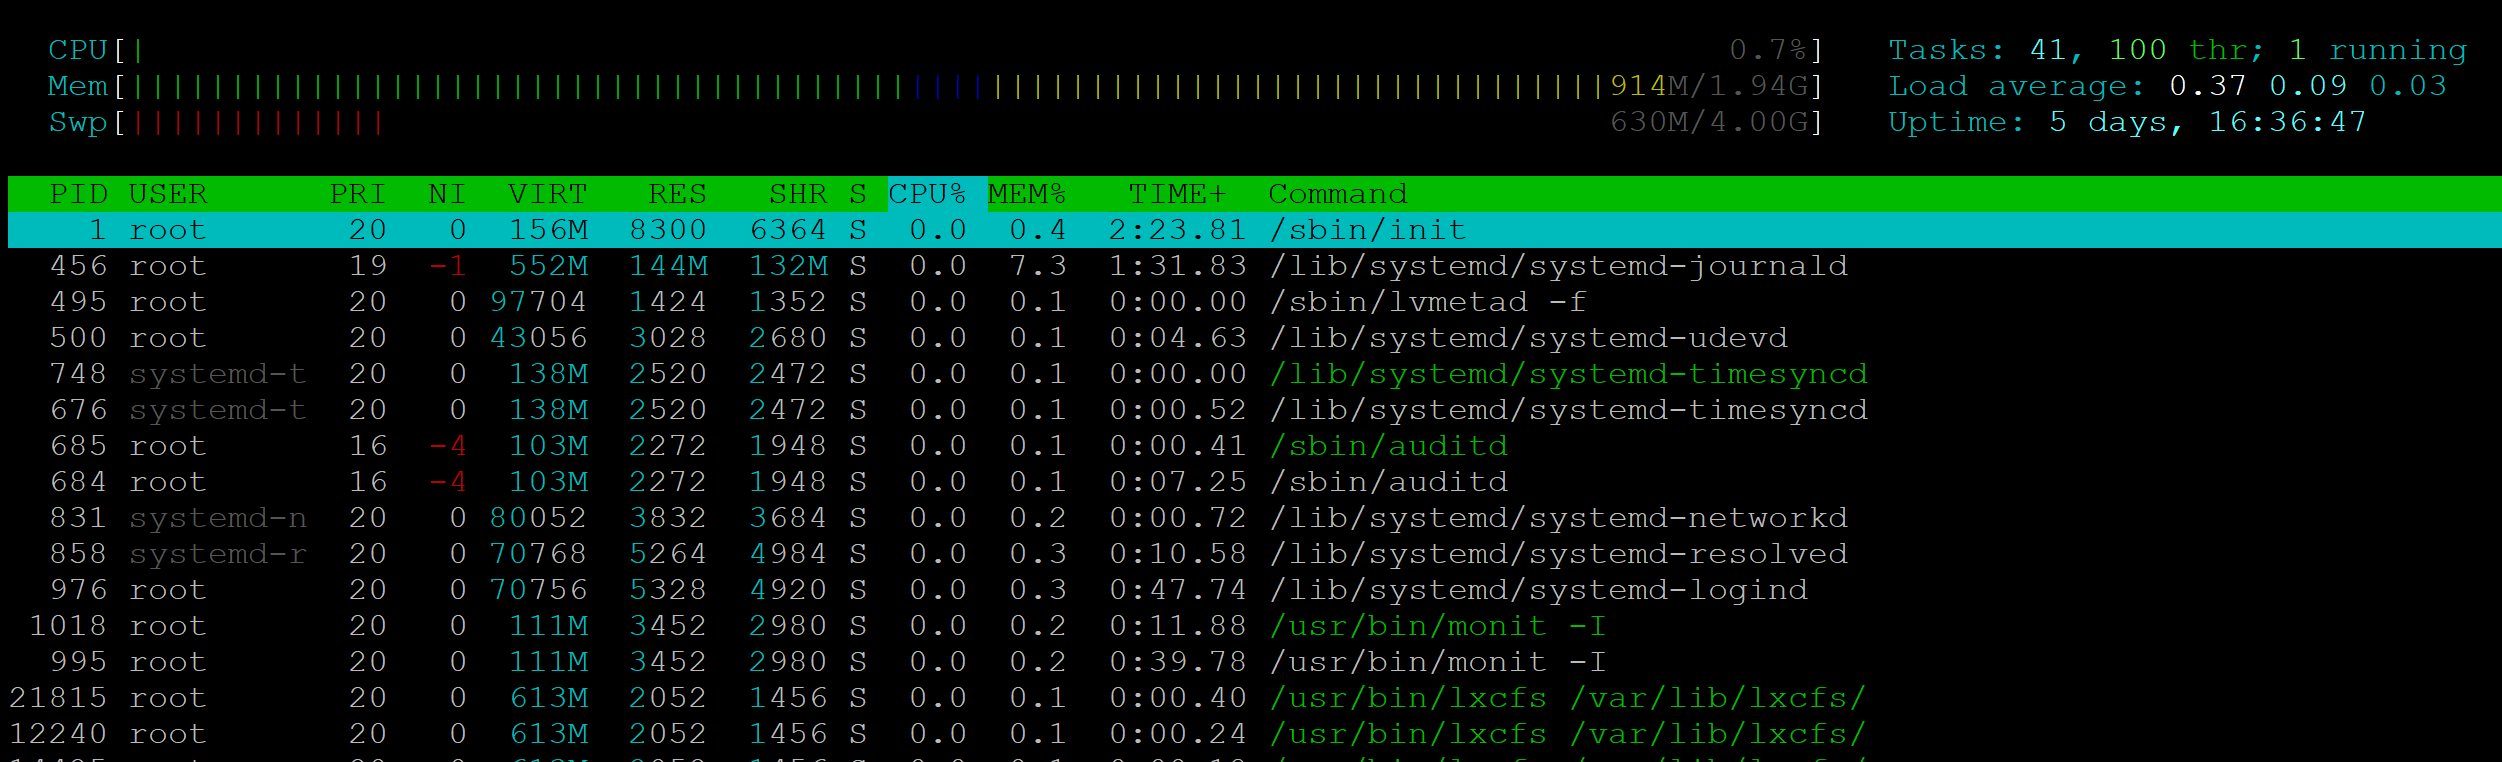
Here you’ll be able to see what’s going on and which of your websites are responsible for any high usage.
If you identify your site, you now dig deeper into what’s going on at the website level. It may also be that a different site than you were expecting is the root of the cause. To exit htop hit Ctrl+C.
You can learn more about using top and htop in these articles:
6. Check Your Website PHP Settings
PHP INI MISCONFIGURATION
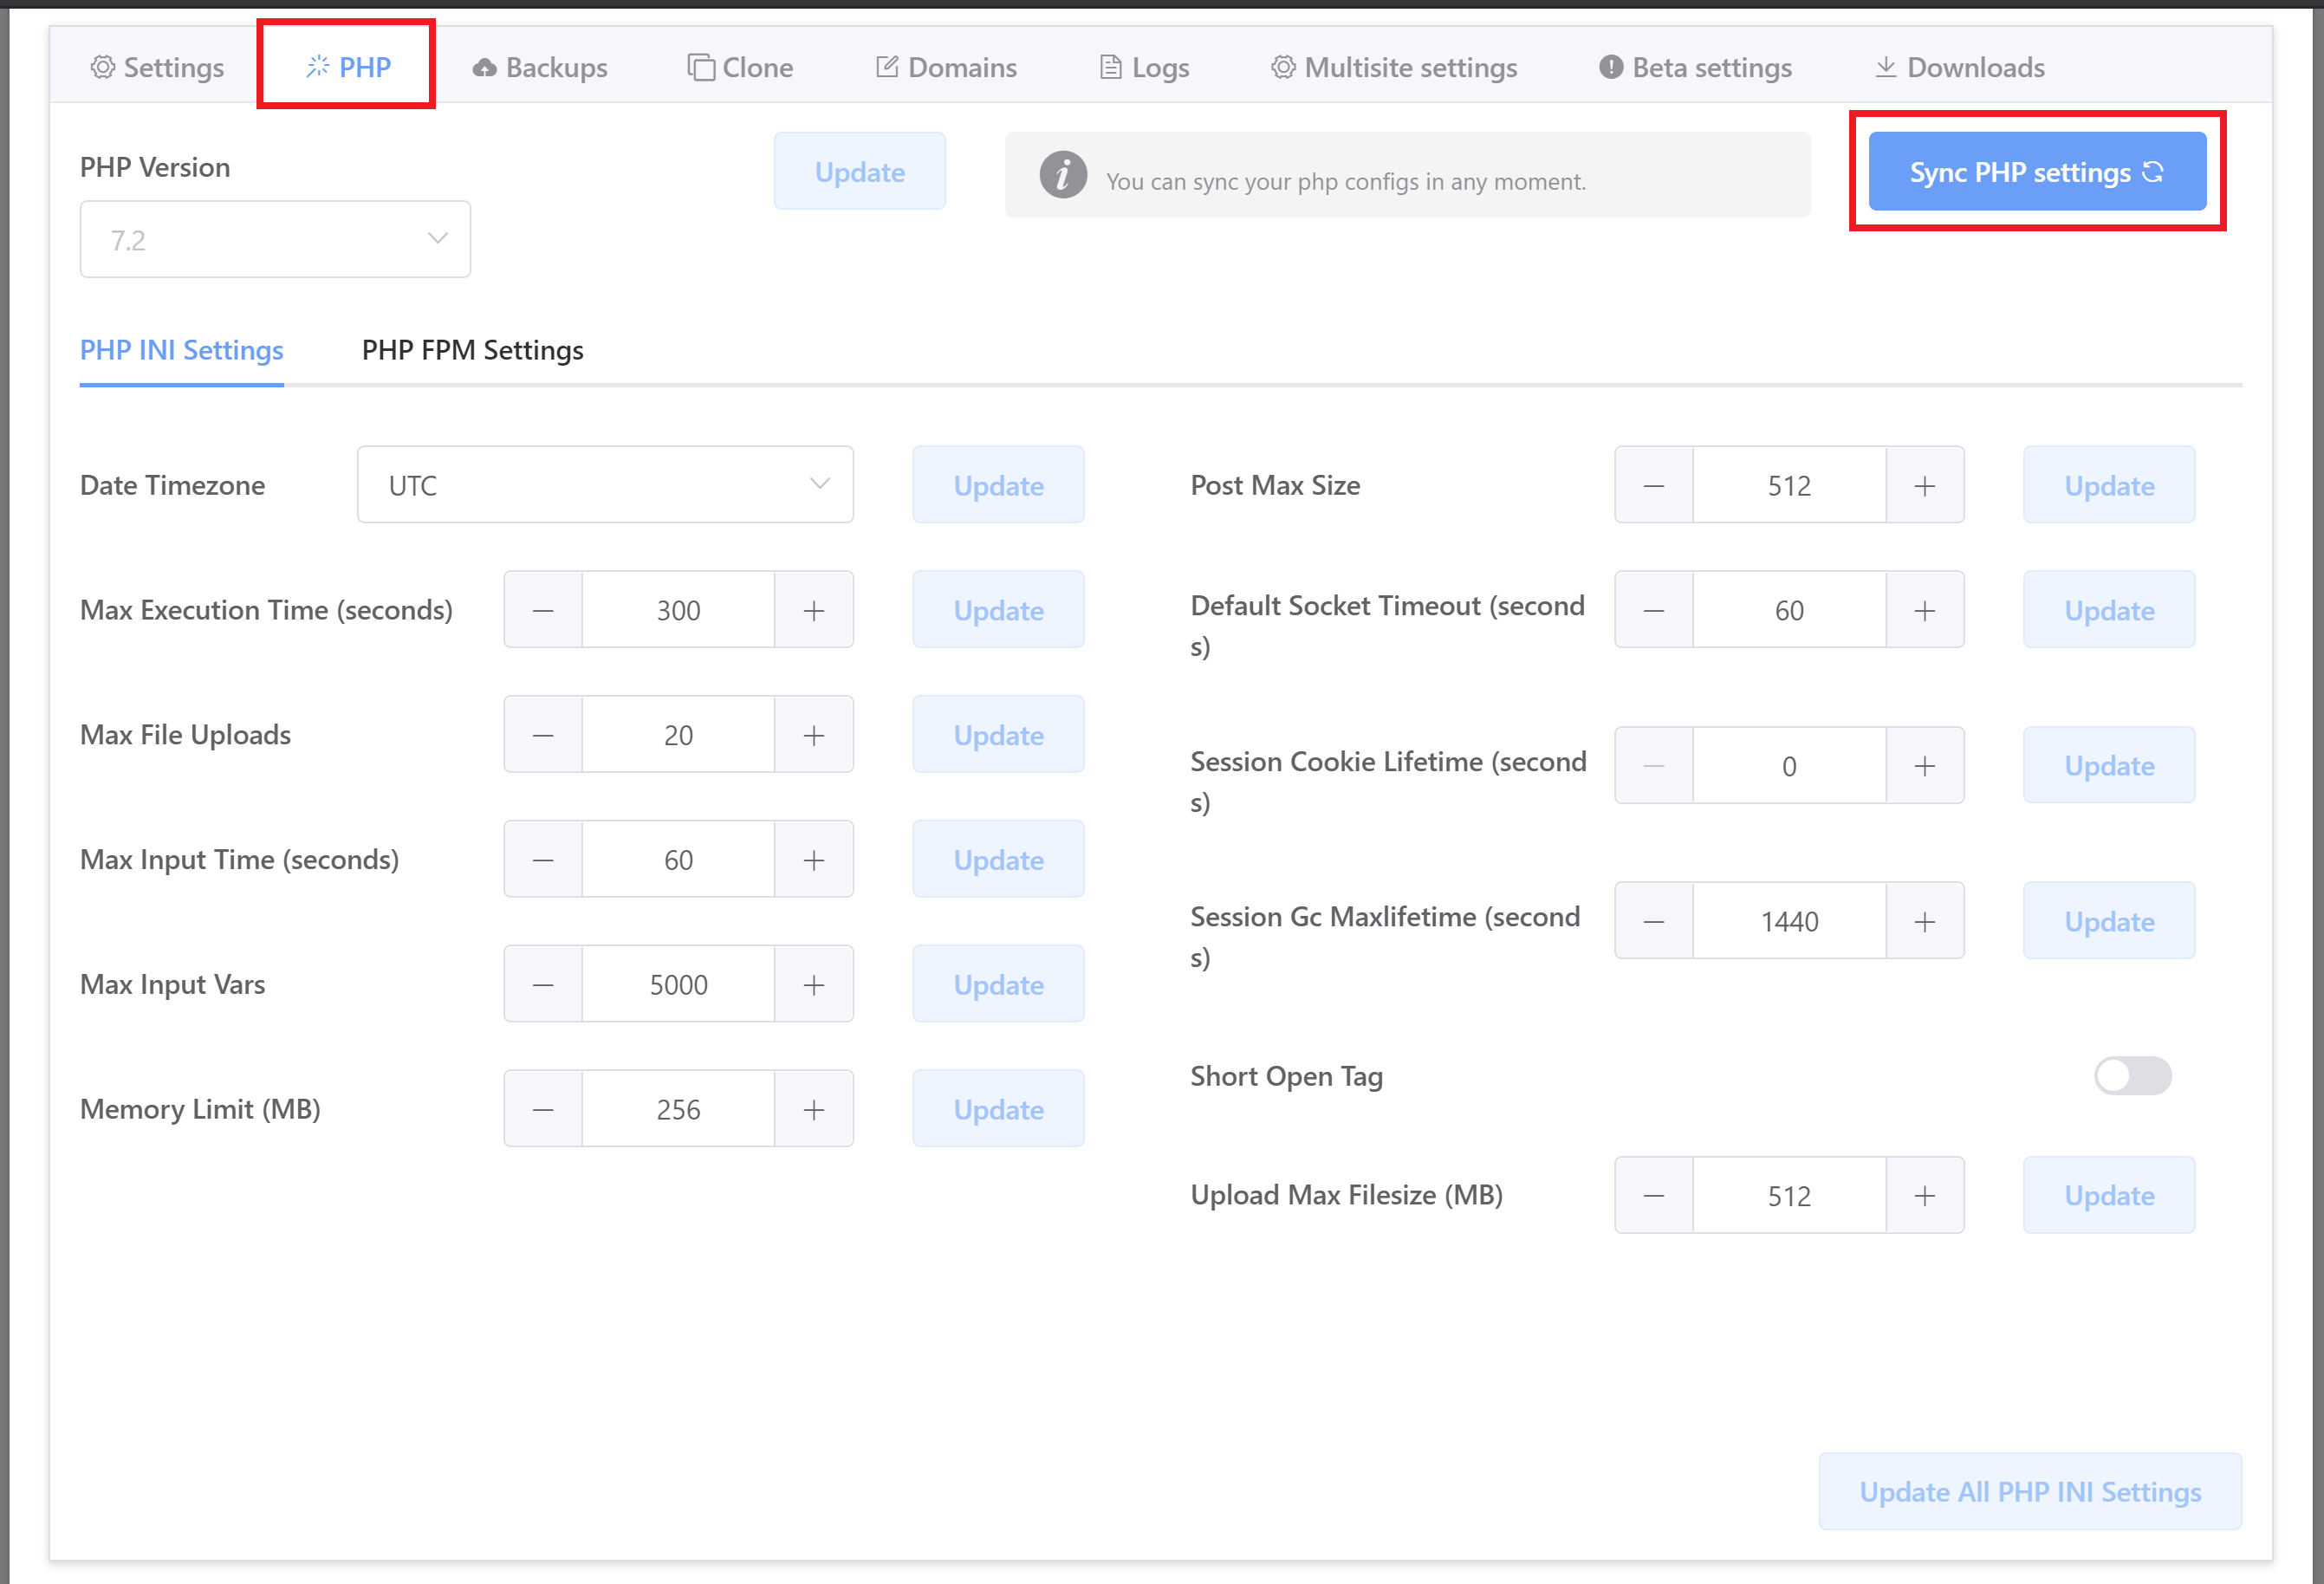
This is rarely an issue, but sometimes see sites that are badly misconfigured – Max Execution Time and PHP memory limit, and other settings are excessively high.
PHP Memory Limit should only be higher than 256 if your website requires more memory than this. Other settings should generally not be higher than the defaults. This is a healthy set of PHP INI settings:
PHP WORKER MISCONFIGURATION
If you’re experiencing long-running requests and you have too many PHP workers set for the available resources, you could be creating a backlog of tasks. This backlog can slow everything, including even simple requests, to a halt.
Open up your website’s customizer and click through to the PHP tab. Next, open the PHP FPM Settings tab and check your configuration. Below are our recommendations for each worker type.
Ondemand
Switch to Dynamic or Static.
Dynamic
For most websites, we recommend Dynamic with a minimum of one “PM Start Server” (active worker), and setting “PM Max Children” to 4 x CPU core (for example if you have a 1 CPU server, set it to 4, if you have a 2 CPU server, set it to 8 and so on). Below is a screenshot from a 2 CPU VPS:
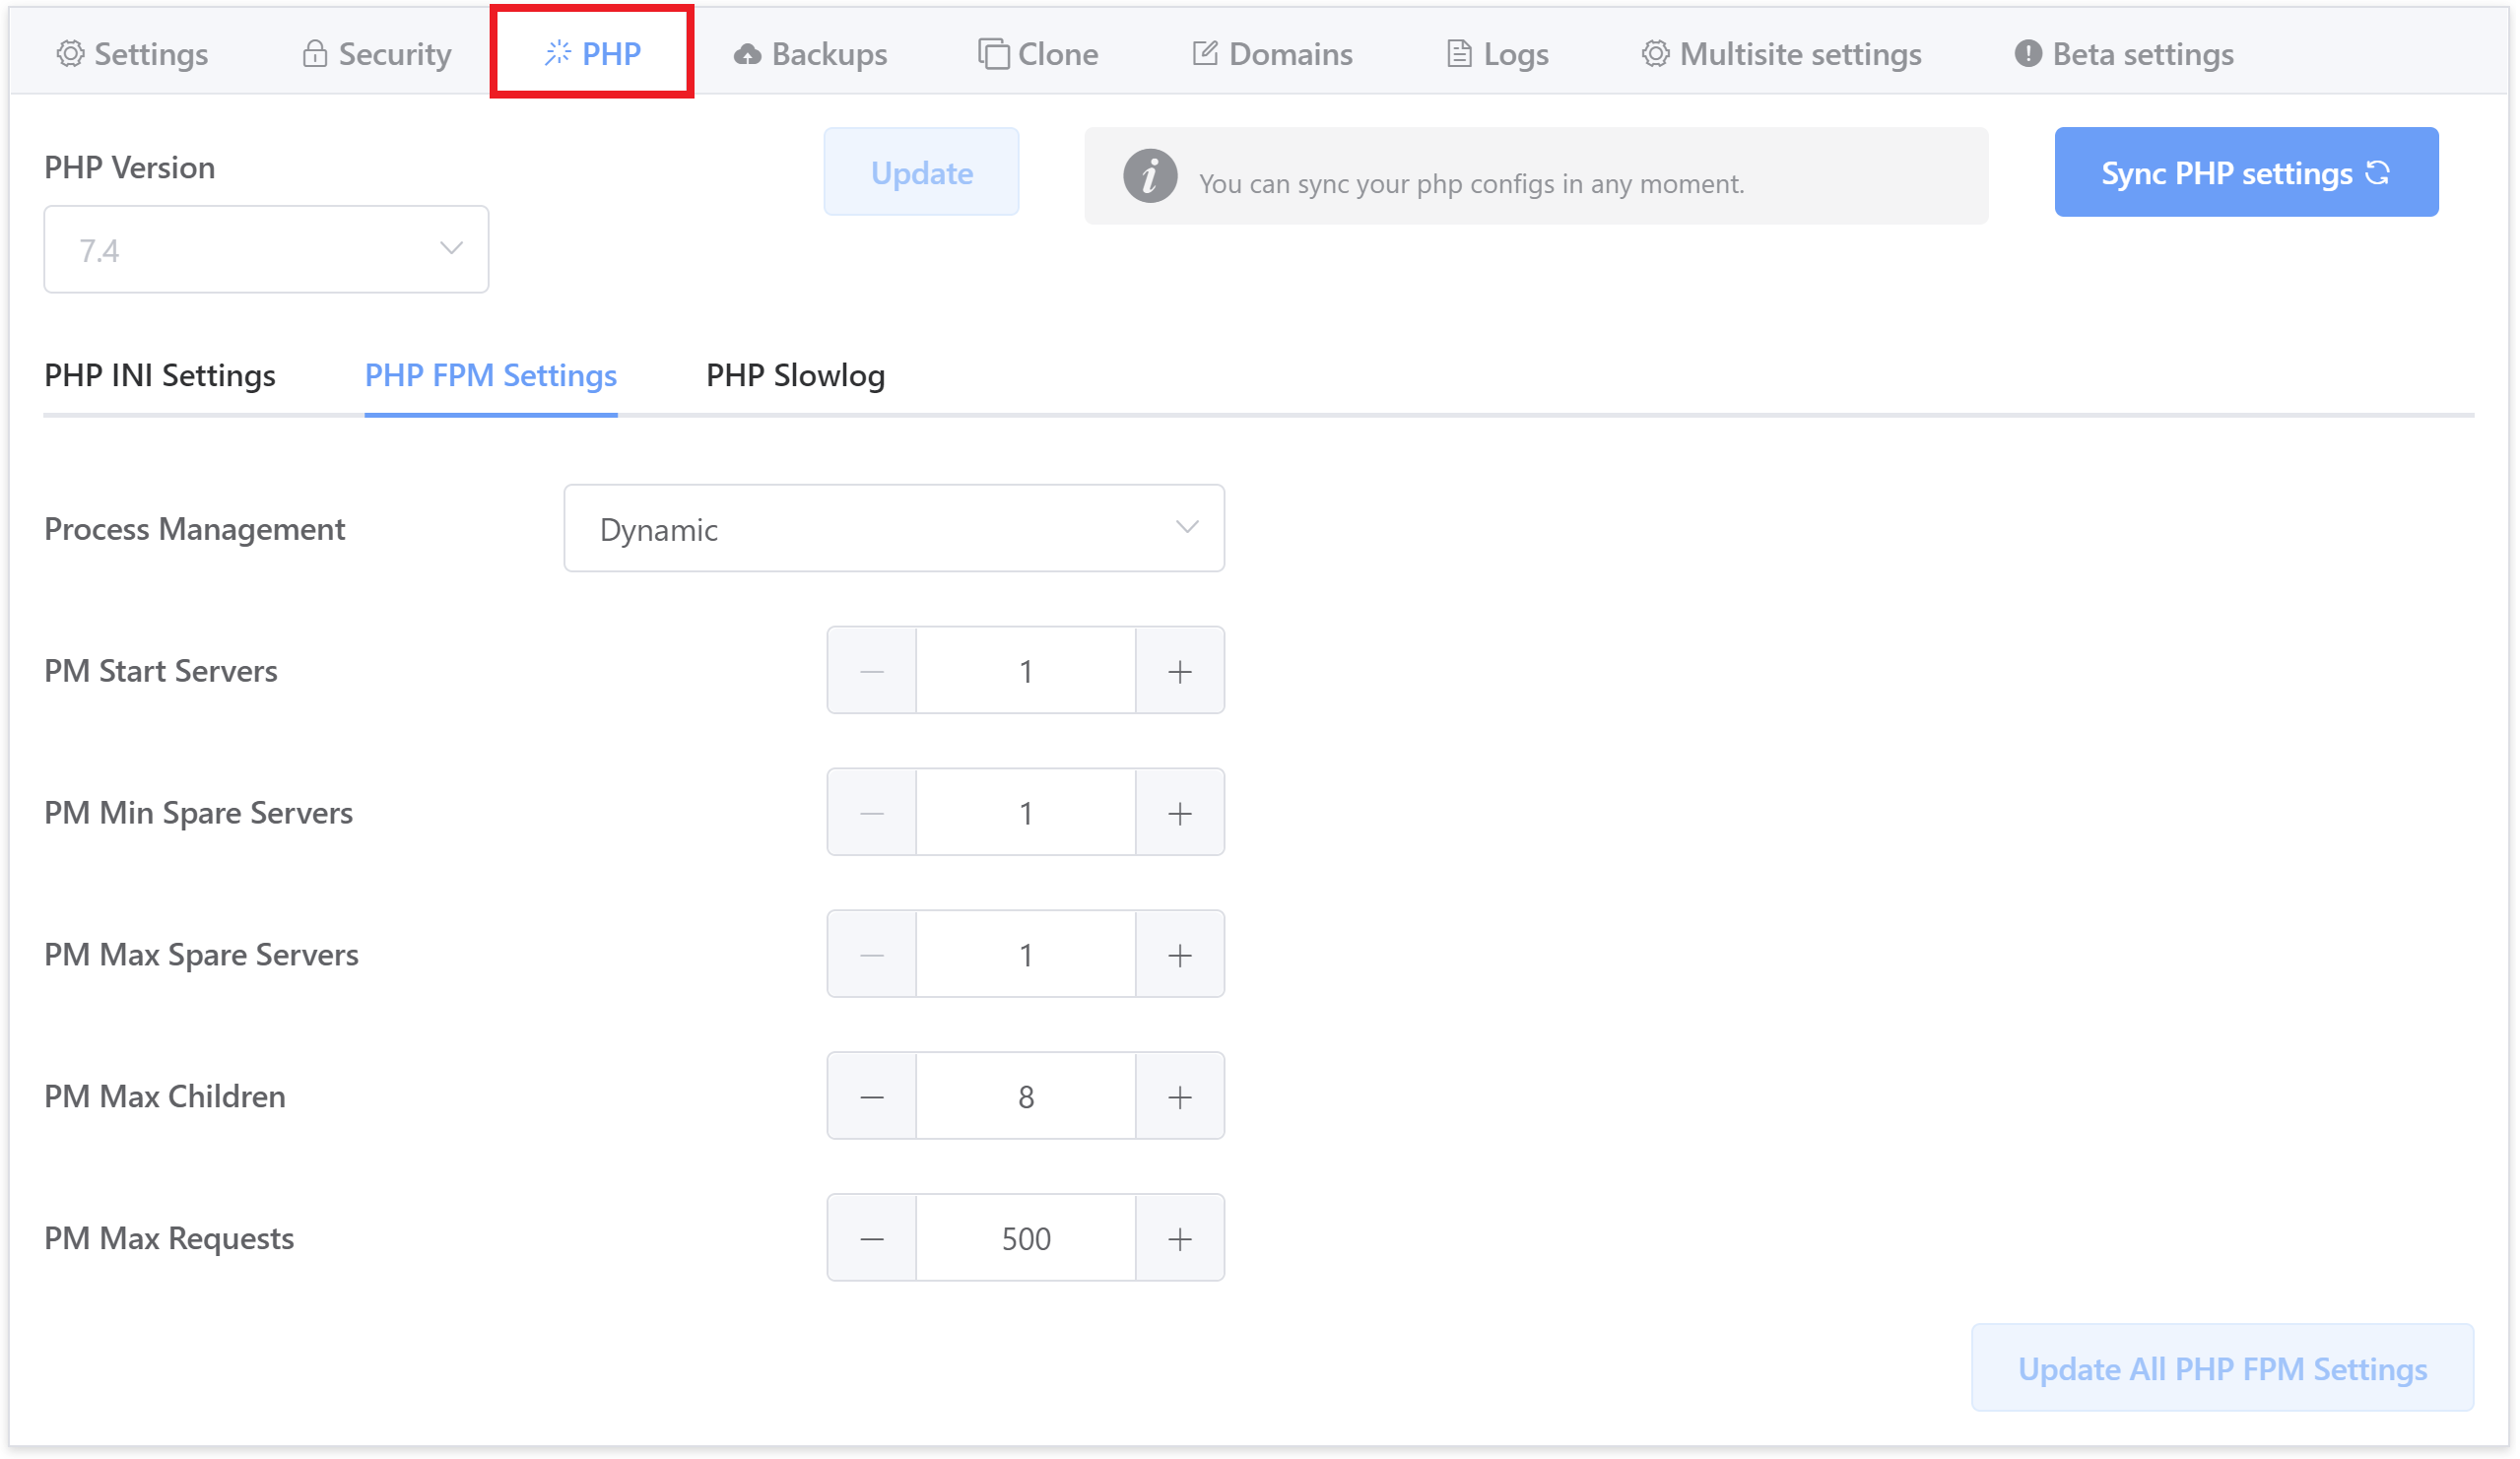
If you’re still experiencing issues, try 3 x workers per CPU core.
Static
Static is better for more dynamic websites and ensures that you have workers active at all times, ready to process PHP. WooCommerce, LMS websites, and sites with lots of cache-bypassing traffic will benefit from static workers. If you’re experiencing timeouts, try adjusting this setting to 3 workers x CPU core. For example, the screenshot below is for a 2 CPU VPS:
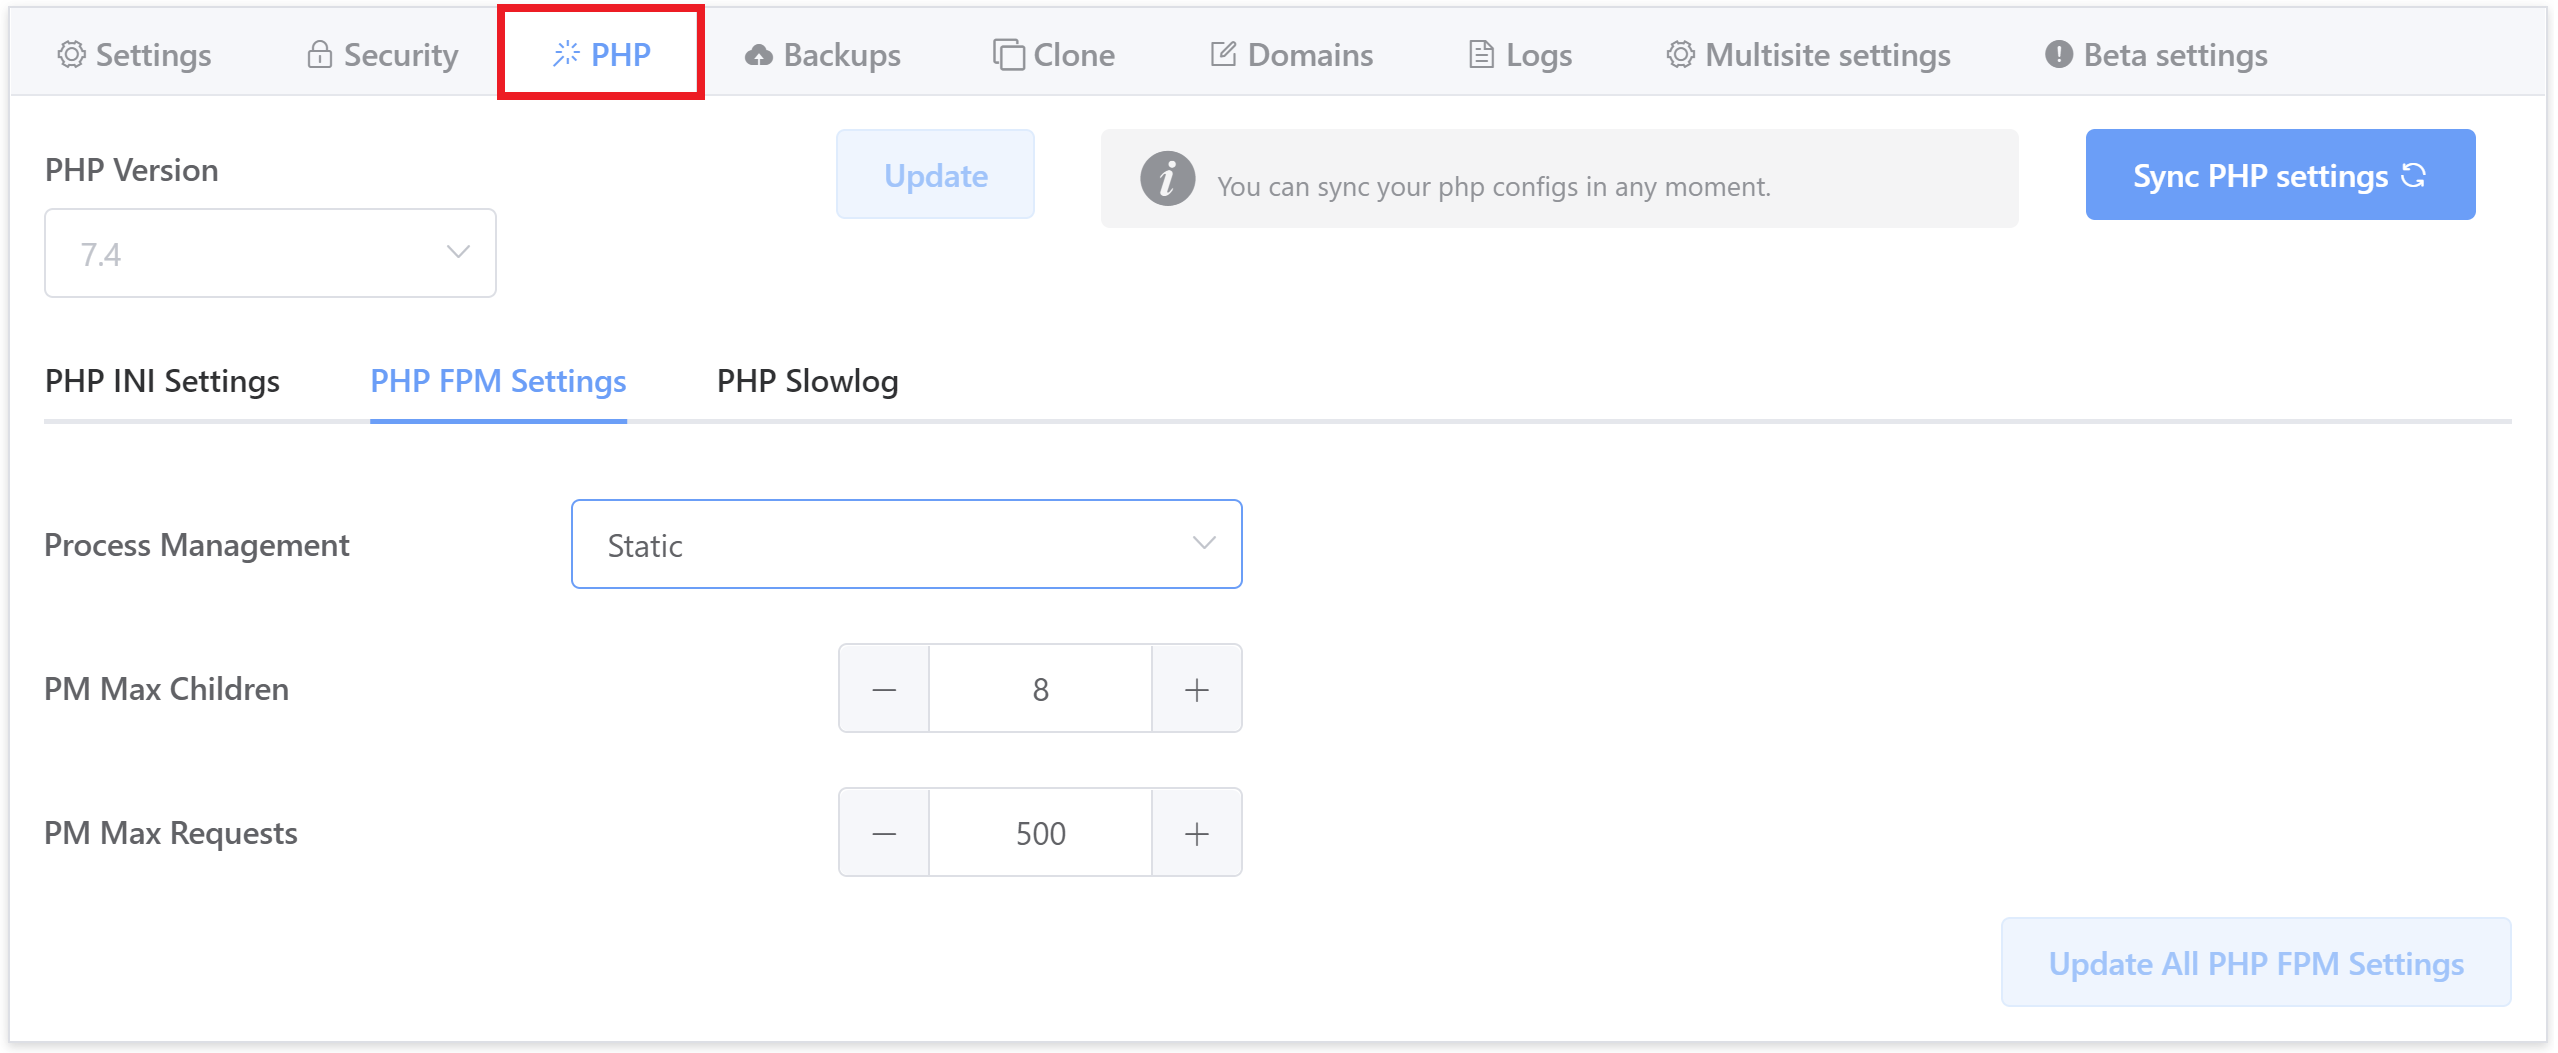
If you’re still experiencing 504s you could reduce to 2 workers per core. This by itself will likely not fix your issue or be the root cause, but it will ensure you’re not pouring gas on the fire.
7. Check Your Access Logs
If your website is experiencing legitimately high traffic and it isn’t under attack, then you likely need a bigger server to handle the load.
1. IS YOUR WEBSITE UNDER ATTACK?
The quickest way to determine whether your website is under attack is to check the Nginx Error log and check the number of rate-limiting errors. If you’re being brute-forced, you’ll see something similar to following targeting either xmlrpc.php or wp-login.php:
[23/Apr/2020:16:23:43 +0000] 69.123.145.184 1.312 - yourwebsite.com "POST //xmlrpc.php HTTP/1.1" 200 413 "-" "Mozilla/5.0 (Windows NT 10.0; Win64; x64) AppleWebKit/537.36 (KHTML, like Gecko) Chrome/78.0.3904.108 Safari/537.36"
[23/Apr/2020:16:23:46 +0000] 69.123.145.184 1.784 - yourwebsite.com "POST //xmlrpc.php HTTP/1.1" 200 413 "-" "Mozilla/5.0 (Windows NT 10.0; Win64; x64) AppleWebKit/537.36 (KHTML, like Gecko) Chrome/78.0.3904.108 Safari/537.36"
[23/Apr/2020:16:23:48 +0000] 68.123.179.184 2.624 - yourwebsite.com "POST //xmlrpc.php HTTP/1.1" 200 413 "-" "Mozilla/5.0 (Windows NT 10.0; Win64; x64) AppleWebKit/537.36 (KHTML, like Gecko) Chrome/78.0.3904.108 Safari/537.36"
[23/Apr/2020:16:23:52 +0000] 69.123.145.184 2.908 - yourwebsite.com "POST //xmlrpc.php HTTP/1.1" 200 413 "-" "Mozilla/5.0 (Windows NT 10.0; Win64; x64) AppleWebKit/537.36 (KHTML, like Gecko) Chrome/78.0.3904.108 Safari/537.36"
[23/Apr/2020:16:23:55 +0000] 69.123.145.184 2.764 - yourwebsite.com "POST //xmlrpc.php HTTP/1.1" 200 413 "-" "Mozilla/5.0 (Windows NT 10.0; Win64; x64) AppleWebKit/537.36 (KHTML, like Gecko) Chrome/78.0.3904.108 Safari/537.36"
[23/Apr/2020:16:23:57 +0000] 69.123.145.184 1.588 - yourwebsite.com "POST //xmlrpc.php HTTP/1.1" 200 413 "-" "Mozilla/5.0 (Windows NT 10.0; Win64; x64) AppleWebKit/537.36 (KHTML, like Gecko) Chrome/78.0.3904.108 Safari/537.36"
[23/Apr/2020:16:23:59 +0000] 69.123.145.184 1.864 - yourwebsite.com "POST //xmlrpc.php HTTP/1.1" 200 413 "-" "Mozilla/5.0 (Windows NT 10.0; Win64; x64) AppleWebKit/537.36 (KHTML, like Gecko) Chrome/78.0.3904.108 Safari/537.36"
[23/Apr/2020:16:29:55 +0000] 69.123.145.184 1.092 - yourwebsite.com "POST //wp-login.php HTTP/1.1" 200 6317 "https://yourwebsite.com//wp-login.php" "Mozilla/5.0 (Windows NT 10.0; Win64; x64) AppleWebKit/537.36 (KHTML, like Gecko) Chrome/78.0.3904.108 Safari/537.36"
[23/Apr/2020:16:29:57 +0000] 69.123.145.184 1.464 - yourwebsite.com "POST //wp-login.php HTTP/1.1" 200 6317 "https://yourwebsite.com//wp-login.php" "Mozilla/5.0 (Windows NT 10.0; Win64; x64) AppleWebKit/537.36 (KHTML, like Gecko) Chrome/78.0.3904.108 Safari/537.36"
[23/Apr/2020:16:29:59 +0000] 69.123.145.184 1.444 - yourwebsite.com "POST //wp-login.php HTTP/1.1" 200 6317 "https://yourwebsite.com//wp-login.php" "Mozilla/5.0 (Windows NT 10.0; Win64; x64) AppleWebKit/537.36 (KHTML, like Gecko) Chrome/78.0.3904.108 Safari/537.36"
[23/Apr/2020:16:30:00 +0000] 69.123.145.184 1.352 - yourwebsite.com "POST //wp-login.php HTTP/1.1" 200 6317 "https://yourwebsite.com//wp-login.php" "Mozilla/5.0 (Windows NT 10.0; Win64; x64) AppleWebKit/537.36 (KHTML, like Gecko) Chrome/78.0.3904.108 Safari/537.36"
[23/Apr/2020:16:30:02 +0000] 69.123.145.184 1.612 - yourwebsite.com "POST //wp-login.php HTTP/1.1" 200 6317 "https://yourwebsite.com//wp-login.php" "Mozilla/5.0 (Windows NT 10.0; Win64; x64) AppleWebKit/537.36 (KHTML, like Gecko) Chrome/78.0.3904.108 Safari/537.36"
[23/Apr/2020:16:30:05 +0000] 69.123.145.184 2.264 - yourwebsite.com "POST //wp-login.php HTTP/1.1" 200 6317 "https://yourwebsite.com//wp-login.php" "Mozilla/5.0 (Windows NT 10.0; Win64; x64) AppleWebKit/537.36 (KHTML, like Gecko) Chrome/78.0.3904.108 Safari/537.36"
[23/Apr/2020:16:30:06 +0000] 69.123.145.184 1.604 - yourwebsite.com "POST //wp-login.php HTTP/1.1" 200 6317 "https://yourwebsite.com//wp-login.php" "Mozilla/5.0 (Windows NT 10.0; Win64; x64) AppleWebKit/537.36 (KHTML, like Gecko) Chrome/78.0.3904.108 Safari/537.36"
If you’re not using XML RPC and it’s getting hit, you can disable it inside your website’s customizer. Open it up and then click through to the Security tab, and then to the additional measures. Click the XML RPC toggle.
If you’re not already using WPFail2Ban, you should activate this too.
2.1 DISCOVER ATTACKING IPS ON NGINX
Next, check your access logs on your server with the following commands. The first two will check for IPs hitting xmlrpc.php and wp-login.php, and the third will list IP accessing your server as a whole.
Check for hits on xmlrpc.php:
cat /var/log/nginx/*access.log | grep xmlrpc | awk '{print $1}' | sort | uniq -cCheck for hits on wp-login.php:
cat /var/log/nginx/*access.log | grep wp-login | awk '{print $1}' | sort | uniq -cCheck overall access for the day:
Here you’ll need to replace the date with the actual current date:
cat /var/log/nginx/*access.log | grep '11/Dec/2021' | sudo awk '{ print $1}' | sort | uniq -c | sort -nrHere you may see some IPs with hundreds or thousands of hits on your website. If that’s the case, run this to display the top 50:
cat /var/log/nginx/*access.log | grep '11/Dec/2021' | sudo awk '{ print $1}' | sort | uniq -c | sort -nr | head -n 502.2 DISCOVER ATTACKING IPS ON OPENLITESPEED
Check for hits on xmlrpc.php:
cat /var/log/ols/*access.log | grep xmlrpc | awk '{print $1}' | sort | uniq -cCheck for hits on wp-login.php:
cat /var/log/ols/*access.log | grep wp-login | awk '{print $1}' | sort | uniq -cCheck overall access for the day:
Here you’ll need to replace the date with the actual current date:
cat /var/log/ols/*access.log | grep '11/Dec/2021' | sudo awk '{ print $1}' | sort | uniq -c | sort -nrHere you may see some IPs with hundreds or thousands of hits on your website. If that’s the case, run this to display the top 50:
cat /var/log/ols/*access.log | grep '11/Dec/2021' | sudo awk '{ print $1}' | sort | uniq -c | sort -nr | head -n 503. BAN OFFENDING IP ADDRESSES
The above commands may display a list like this:
root@ols-test-server:~# sudo awk '{ print $1}' /var/log/ols/*access.log | sort | uniq -c | sort -nr | head -n 10
1333 "94.137.186.125
399 "1.46.145.212
349 "107.150.94.78
336 "54.93.217.201
333 "122.155.174.174
195 "185.70.52.218
139 "185.225.234.174
92 "185.225.234.59
88 "185.225.234.199
65 "1.46.4.227
You can block these IP’s by running the following command on your server:
ufw deny from {IP.Address}For example:
ufw deny from 199.199.199.19
4. MITIGATE ATTACKS WITH CLOUDFLARE
If you’re using Cloudflare or have a security plugin such as WordPress you can add these IP’s to your blacklist, but you’ll also want to check out our Fail2Ban article here:
Configuring Fail2Ban to Prevent Brute Force Attacks
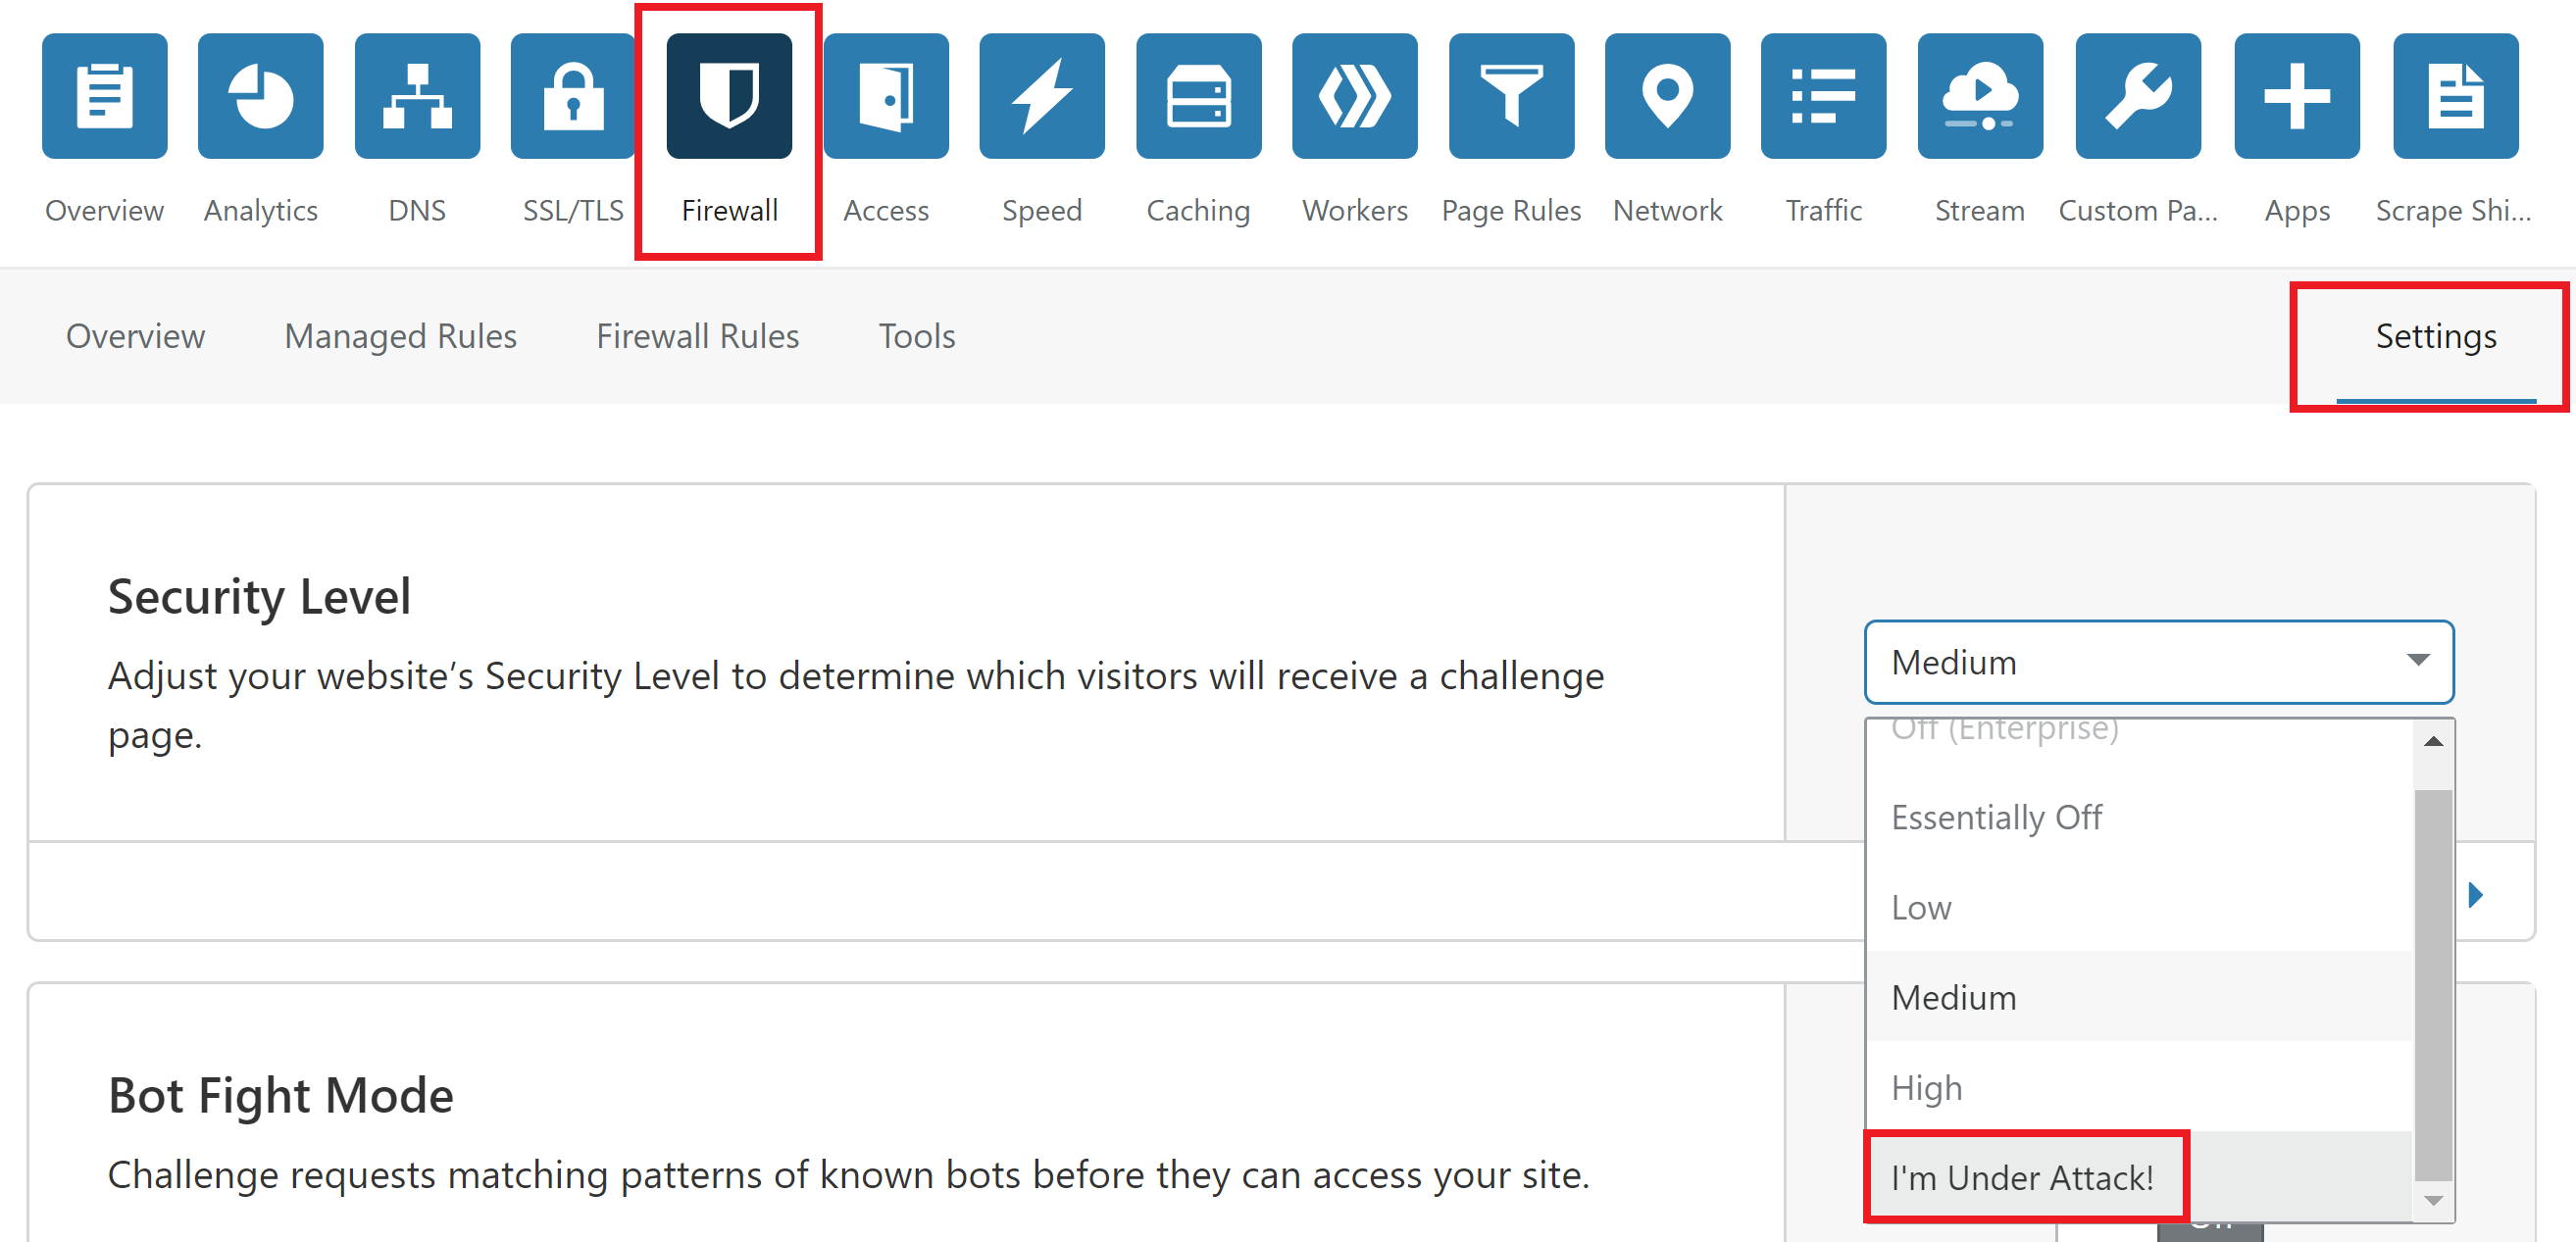
And if you’re not already on Cloudflare, consider a move there and activate DDOS protection. You can enable I’m Under Attack mode via the following steps:
- Log in to your Cloudflare account.
- Select the domain to protect.
- Click the Firewall app.
- Click the Settings tab.
- Under Security Level, select I’m Under Attack!