Verdant TCS

Diagnosing 503 Errors

5 min read

Introduction

503 Service Unavailable errors are pretty rare on vCanopy.

There are multiple different possible causes, but by far the most common is our inbuilt rate-limiting affecting a plugin that’s running a task.

Other reasons include plugin and/or theme compatibility issues, fatal PHP errors, server overload, or maintenance mode gone wrong.

The messaging that displays with your 503 error may vary, but the variations don’t indicate any specific issues. Here are a few common examples:

  • HTTP Error 503
  • HTTP Server Error 503
  • 503 Service Unavailable
  • 503 Service Temporarily Unavailable
  • Error 503 Service Unavailable


WHAT CAUSES 503 ERRORS

These occur when the server isn’t able to send back a valid response to the browser.

BUT MY CODEBASE HASN’T CHANGED?

If you’re keeping your website up-to-date, your codebase regularly changes, even if you aren’t adding new plugins. Updates can cause conflicts, and if you’re migrating from a different host they may have left some scripts or plugins behind that are very specific to their own hosting environment.

503 DEBUG

Debug for 503 errors ALWAYS starts in your website’s errors logs.

Below is a step-by-step checklist to diagnose your 503 errors by quickly narrowing down the root of the cause. 

Check the Error Logs

The reason for your 503 will be logged inside your website’s Nginx / OpenLiteSpeed Error Log.

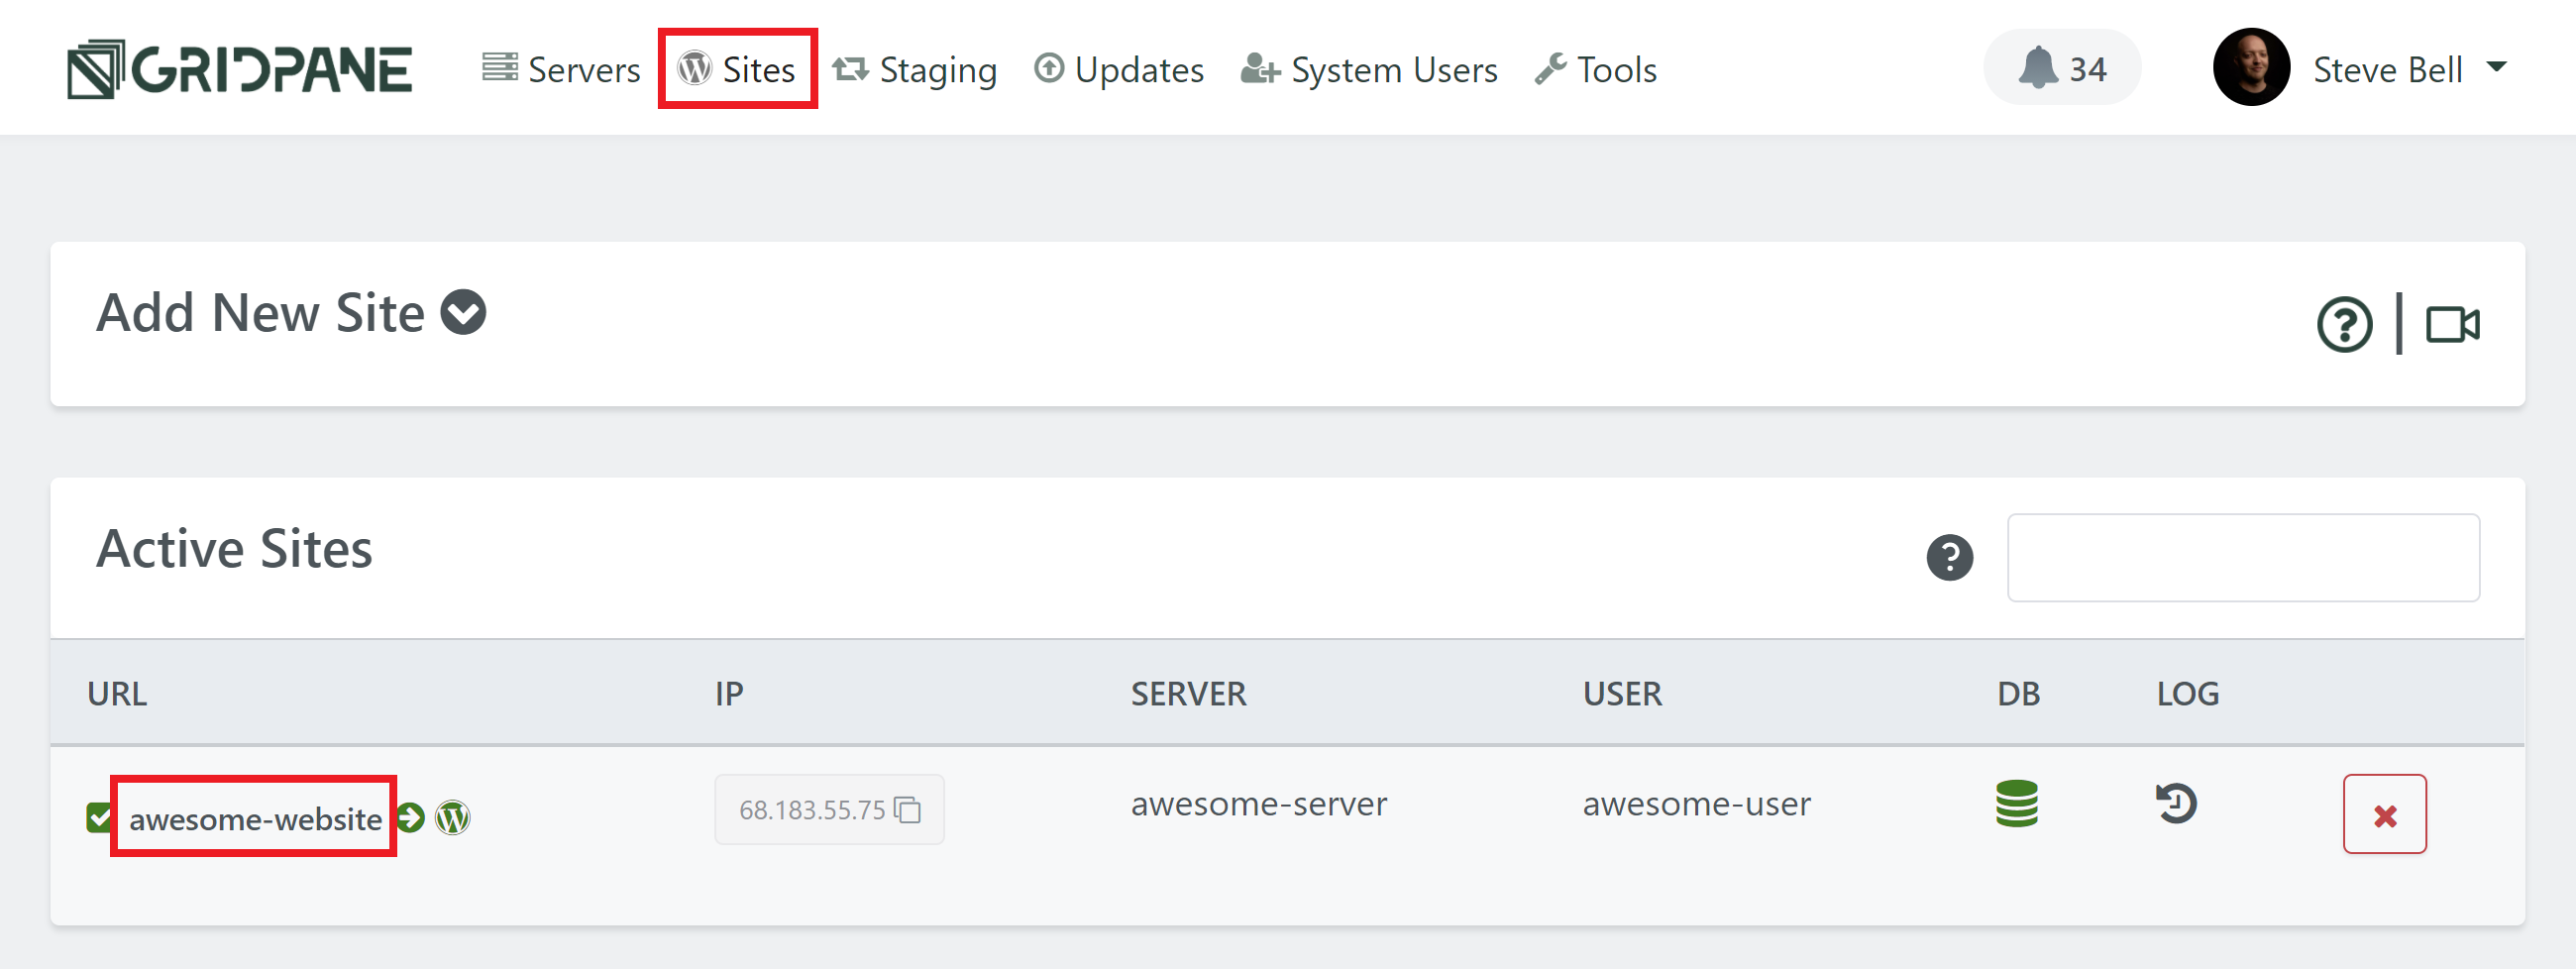
You’ll find all of your website-specific error logs inside your website’s customizer. Head to the Sites page within your account and click on the name of the website you’re having trouble with to open the customizer. Next, click through to the logs tab:

You’ll find the Nginx / OpenLiteSpeed error log at the bottom:

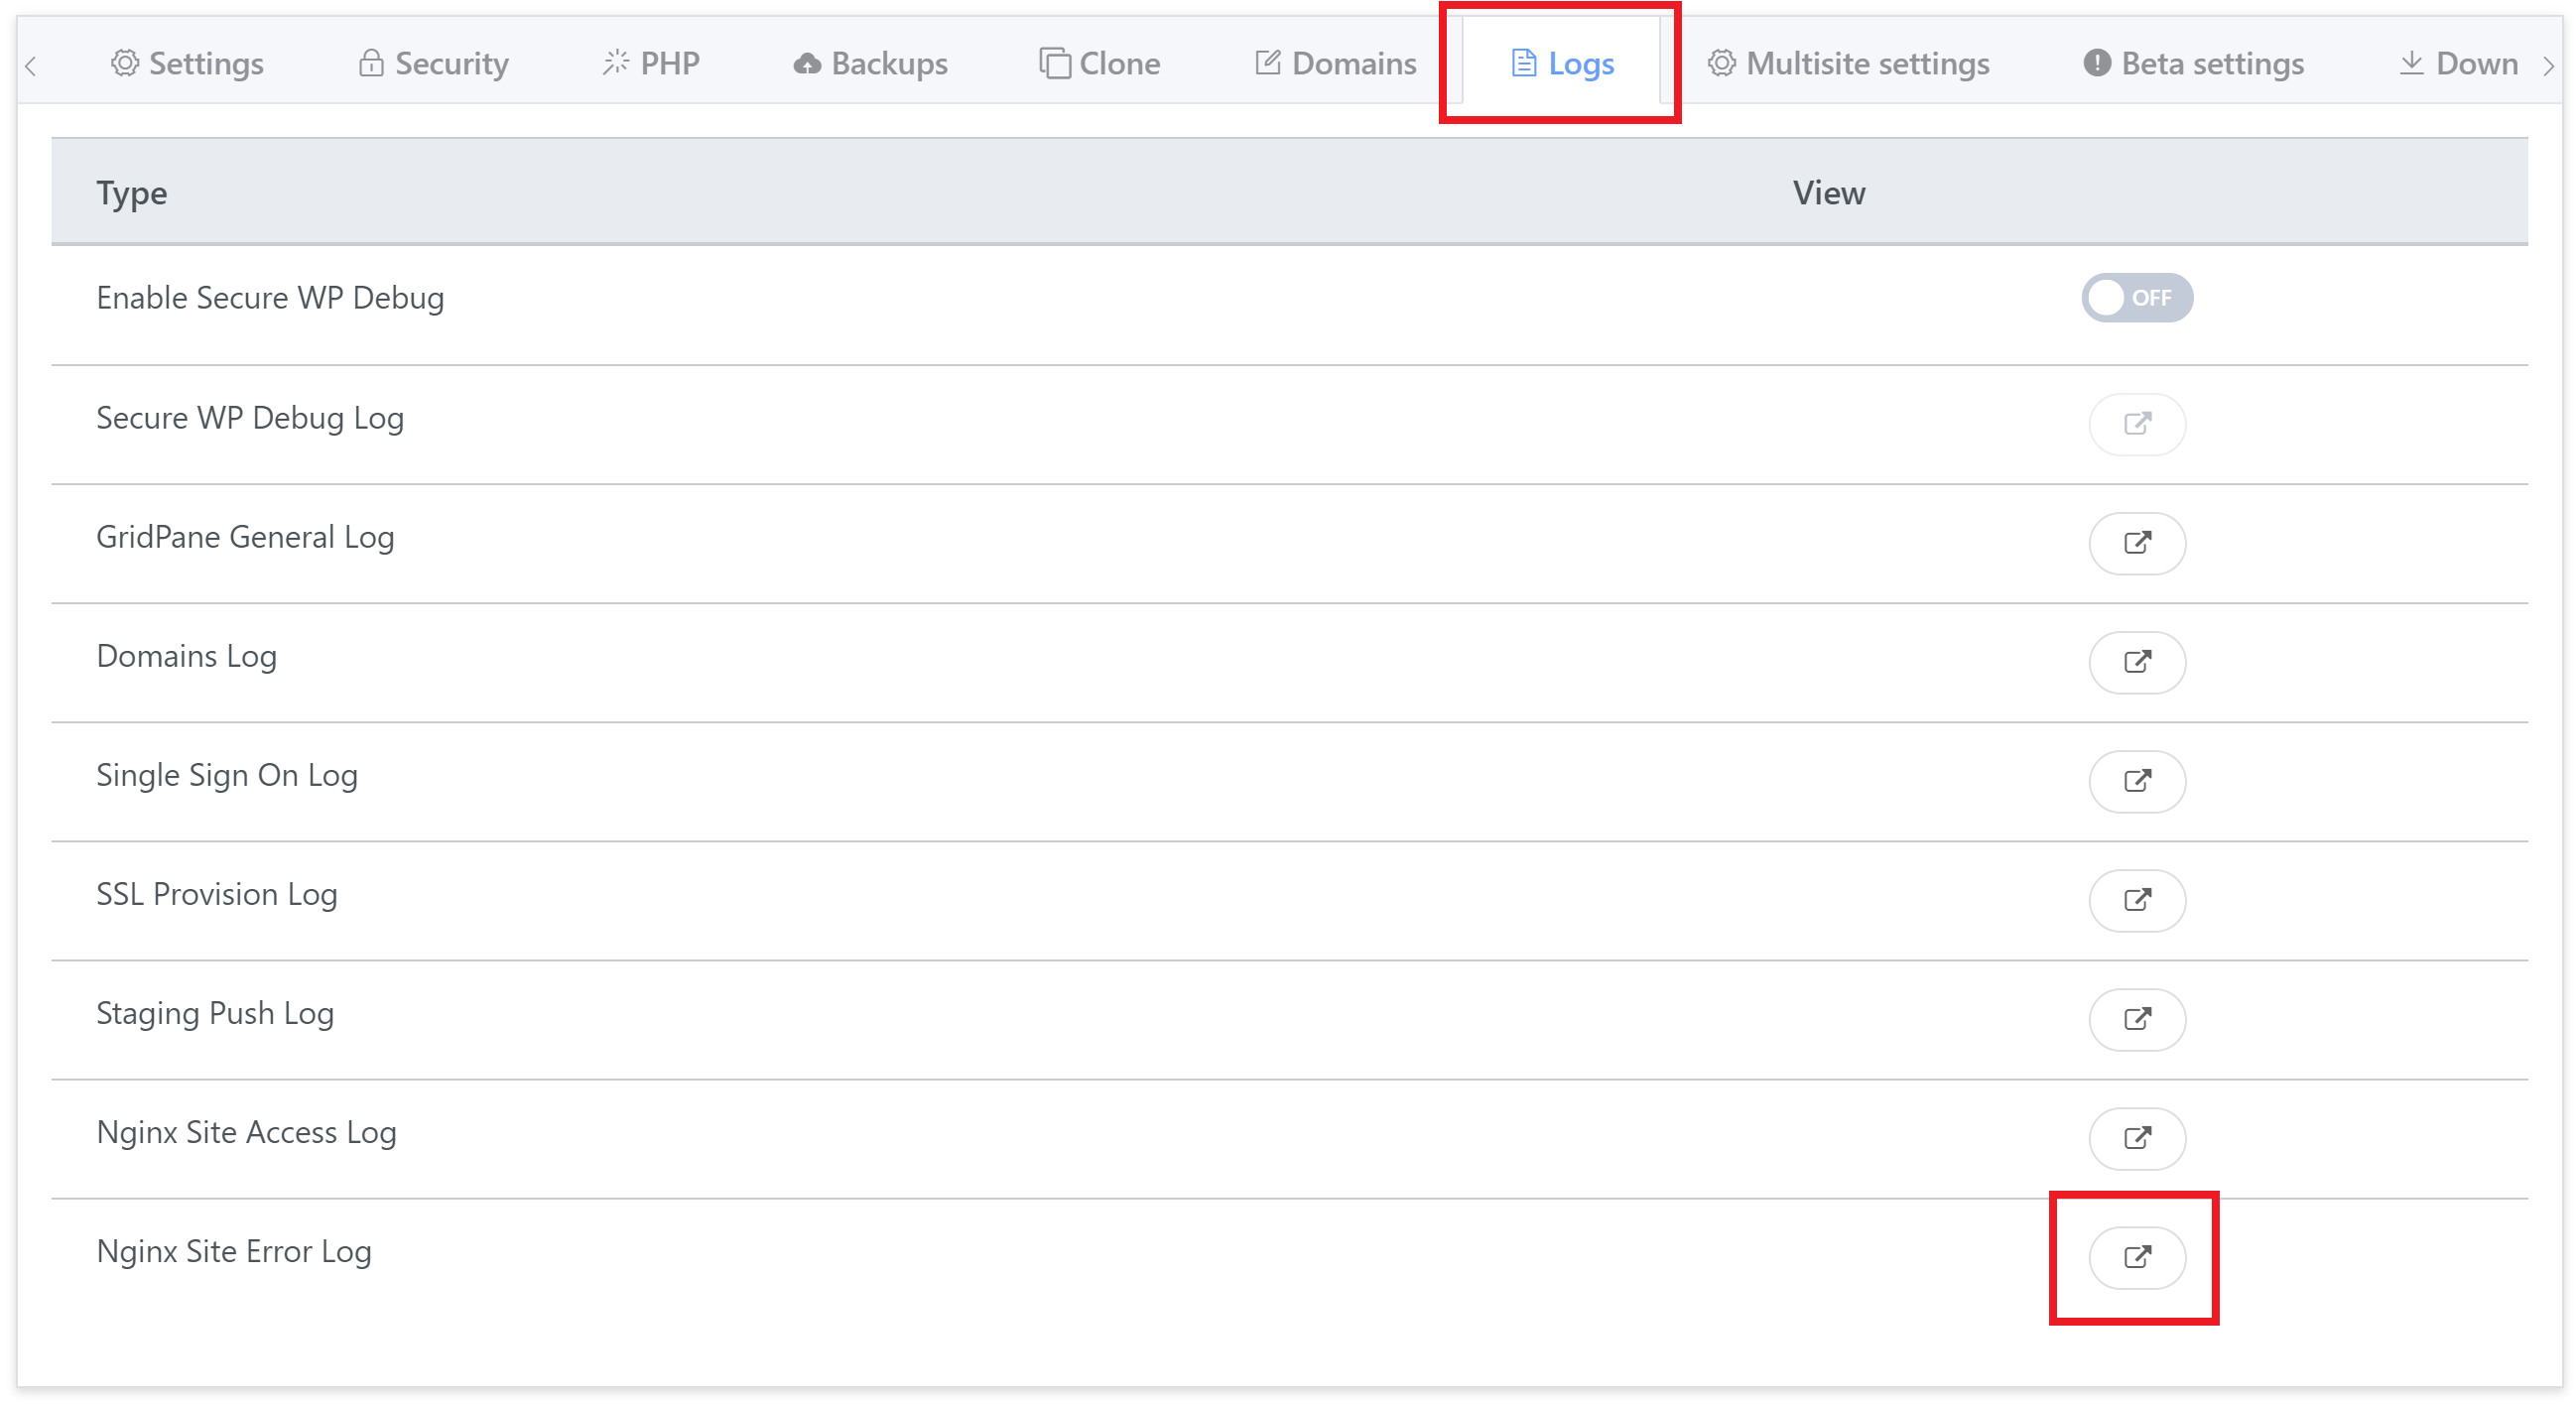
When checking the log, look for the errors that correspond to your timestamps.

You can also activate WP Debug by clicking the toggle at the top of this tab, and this will install the query monitor plugin and potentially log more specific errors. More details on this can be found here:

WordPress Debug and Query Monitor

EXAMPLE ERRORS

Here’s an example of a rate-limiting error:

2020/04/25 10:50:52 [error] 30125#30125: *710261 limiting requests, excess: 6.364 by zone "wp", client: someiphere, server: vCanopydemo.com, request: "POST /wp-admin/admin-ajax.php HTTP/1.1", host: "vCanopydemo.com", referrer: "https://vCanopydemo.com/wp-admin/admin.php?page=oxygen_vsb_sign_shortcodes"

Here’s an example of a fatal error:

2021/07/16 00:29:14 [error] 30056#30056: *159 FastCGI sent in stderr: "PHP message: PHP Notice: Undefined variable: has_tpp in /var/www/example.com/htdocs/wp-content/plugins/event-tickets-plus/src/views/v2/modal/attendee-registration/footer.php on line 19PHP message: PHP Fatal error: Uncaught Error: Call to undefined function esc_html_e() in /var/www/example.com/htdocs/wp-content/plugins/event-tickets-plus/src/views/v2/modal/attendee-registration/footer.php:25
Stack trace:
#0 {main}
thrown in /var/www/example.com/htdocs/wp-content/plugins/event-tickets-plus/src/views/v2/modal/attendee-registration/footer.php on line 25" while reading response header from upstream, client: 19.19.19.199, server: example.com, request: "GET /wp-content/plugins/event-tickets-plus/src/views/v2/modal/attendee-registration/footer.php HTTP/1.1", upstream: "fastcgi://unix:/var/run/php/php73-fpm-example.com.sock:", host: "www.example.com"

OPENLITESPEED STDERR.LOG (NOT AVAILABLE IN UI)

The stderr.log is only accessible via the command line at this time. This log is usually the most helpful when determining why PHP is throwing 503 errors on OLS. Check the last 200 lines with:

tail -200 /usr/local/lsws/logs/stderr.log

OPENLITESPEED WEB SERVER ERROG.LOG (NOT AVAILABLE IN UI)

The following can be useful for diagnosing 503 errors. However, most of the time, the error log doesn’t give you the reason why the 503 error happened. It only shows you when it happened and with which domain it happened.

grep oops /usr/local/lsws/logs/error.log

NEXT STEPS

After reviewing the log/s, you’ll know whether this was a rate-limiting error or an issue with your website’s codebase. The next steps can be found in the following sections.

Disable Your CDN/Cloudflare Proxy (if applicable) 

If you have any kind of CDN active, disable it for the moment and then try again. If it’s not the cause of your 503 error you can continue below.

As an additional note here, one thing we’ve seen in the past is custom firewall rules implemented inside Cloudflare causing 503 errors. 

Rate Limiting

vCanopy has two zones that it applies rate limiting to: 

  1. Zone One
  2. Zone WP


Zone One protects the WordPress Login URL and prevents more than 1 page-load per second per IP address.

Zone WP is where you’ll be getting limited.

The solution is to either create a whitelist rule or increase our rate limit. The article linked below has all the information on how to do this both for individual websites or server-wide for all your websites on your server. What you choose will depend on your requirements, for example, if you’re using the same plugin on each of your websites, you may wish to implement this server-wide and plan on leaving them high.

We recommend adjusting things for just one specific website and then turn them back down once you’re done.

Nginx Rate Limiting and Plugins

Website Codebase Errors

The logs should reveal the  plugin or theme that’s at the root of your issue and the reason for the error. Depending on what that error is will of course guide your next step. However, if you were still unable to pinpoint the root cause, you may want to start by deactivating all of your plugins first and checking to see if this fixes the issue. Details below.

OpenLiteSpeed tends to be more 503 error-prone than Nginx. If you’re running OpenLiteSpeed and wasn’t able to identify the issue, you may want to check the section below first.

TEST YOUR PLUGINS

If you spot an issue with a specific plugin you can deactivate it and then check the site again. This can be common with plugins that are specific to the previous hosting provider (often installed as “must-use” plugins).

If you’re unable to login, try renaming your plugins folder. To do this, connect to your server via SFTP and rename it from “pluginname” to something like “pluginname-test”. Now retest your website. Has this solved the problem?

If no, change the folder’s name back.

Next, try renaming the entire plugins folder from “plugins” to “plugins-test”. Does this fix the issue?

If yes, then rinse and repeat with each of your individual plugin folders until you find the cause. You can change their name’s back once you’ve identified the problematic plugin.

TEST YOUR THEME

If plugins aren’t the cause, try changing themes. If you can’t access your site, simply rename your themes folder from “themename” to “themename-test”. WordPress should default to the latest standard theme. If you don’t that installed, you can download it from the WordPress repository and then upload it via SFTP (upload the unzipped version).

OpenLiteSpeed 503 Errors 

OpenLiteSpeed tends to be more 503 error-prone than Nginx. Below are a couple of things to look out for.

.HTACCESS RULES ARE REQUIRED FOR A PLUGIN

If you’ve identified a plugin to be the root cause of your issue, does it require any .htaccess rules to be in place for it to function correctly?

LITESPEED CACHE PLUGIN CRAWL SETTINGS

High crawl settings for any large site on a server can cause a cache clash for ALL sites hosted on that server.

This is because the cache is managed in a single place by OLS, instead of individually on a per site basis.

Here you should look at setting a lower crawl rate for ALL of your sites, so that each site can have a reasonable amount of access to the CPU to create a cache.

What you are experiencing is basically a software deadlock, as the cache files are incremented hashes, and two different sites could ask for the same next file but one of them is writing to it and it causes a deadlock for all the others.

This guide from LiteSpeed explains crawler settings in more detail:

https://docs.litespeedtech.com/lscache/lscwp/crawler/#general-settings-tab

Search the Knowledge Base

New to vCanopy?

Get started with our FREE Core plan today! We bring the software, you bring the hardware.